Two full applications, multi-cloud infrastructure, automated cloud monitoring and a robotics simulation. They show how we design, test and ship, and Darviq-Health is open for clinic pilots.
Software for the front of a small clinic or hospital: booking and reminders, the doctor's queue, prescriptions and the bill, with AI to take the typing off the doctor.
Patients book a 15-minute slot with a doctor online, or reception books for them. A doctor can't be double-booked, and check-in sends the patient straight to the doctor's queue.
The doctor picks up the next patient, records the diagnosis and writes the prescription. The patient sees both in their own account.
Itemised invoices per visit, paid by cash, card or UPI. Only an admin can cancel an unpaid bill, and a paid bill can't be paid twice.
Patients, reception, doctors and admins each see only what their role allows. The server enforces it, and automated tests check that one patient can never open another's records.
The doctor types shorthand such as “URTI. PCM 650 1-0-1 x5d” and Claude drafts the diagnosis, the prescription rows and a plain-language summary for the patient, with a list of anything to double-check. Nothing is saved until the doctor approves it, and the AI never sees the patient's name.
A reminder the day before each appointment by email, and on WhatsApp for patients who opt in. Patients can also reset a forgotten password by email.
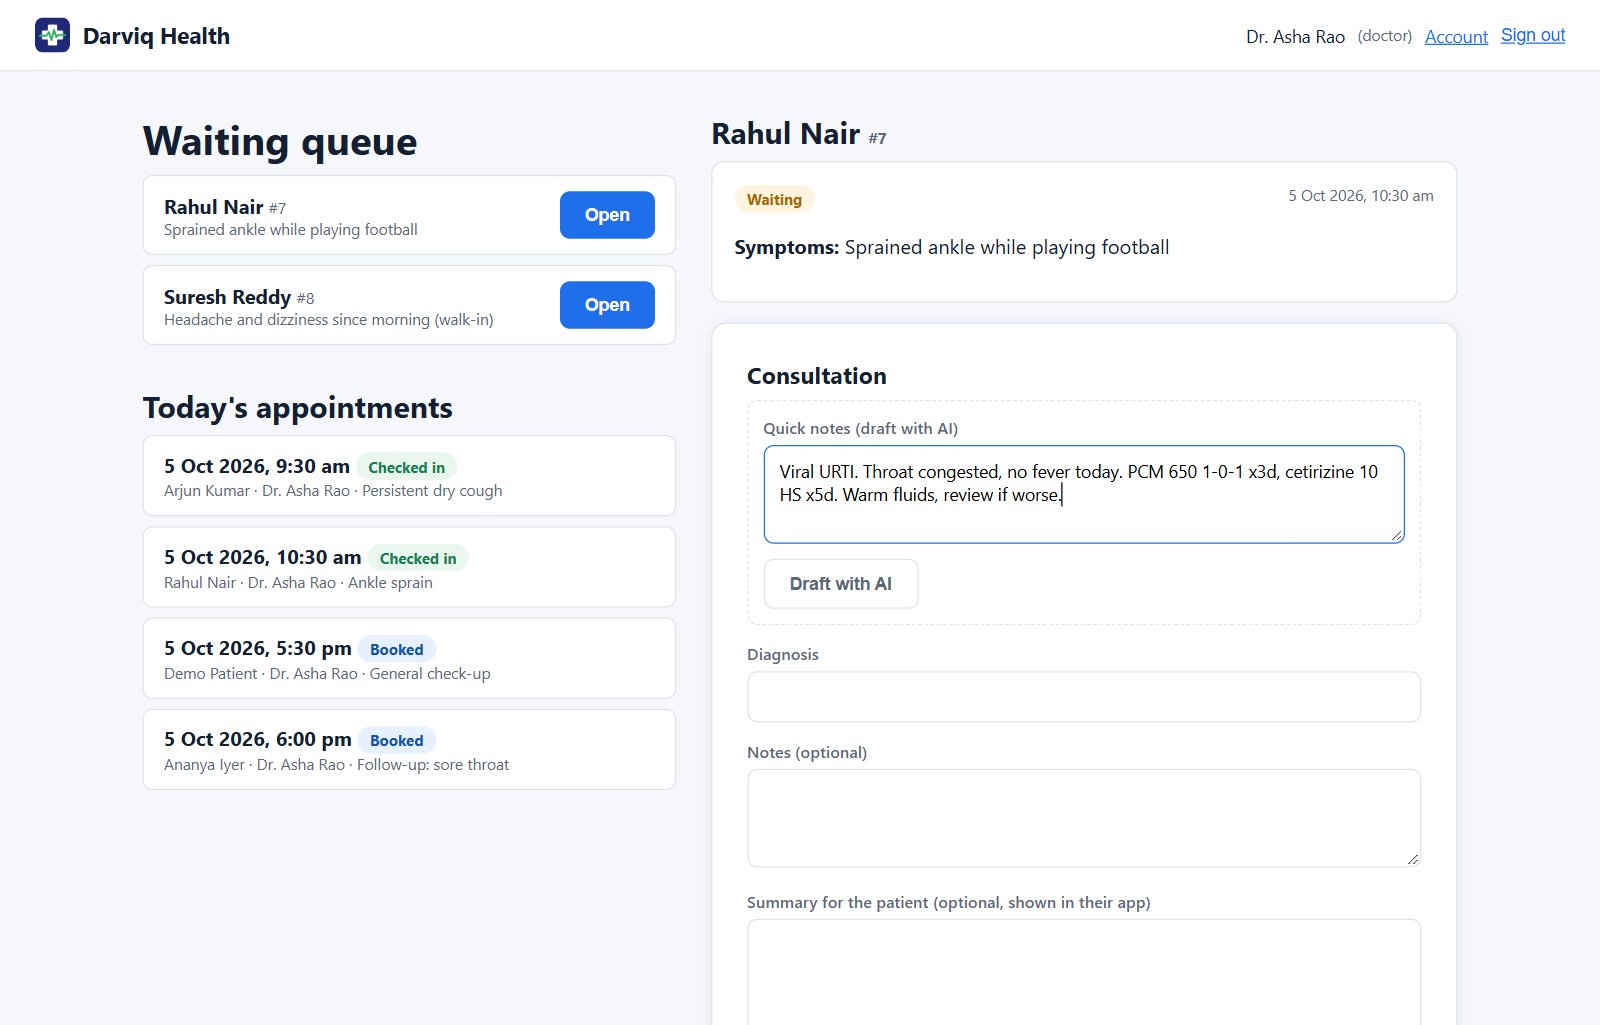
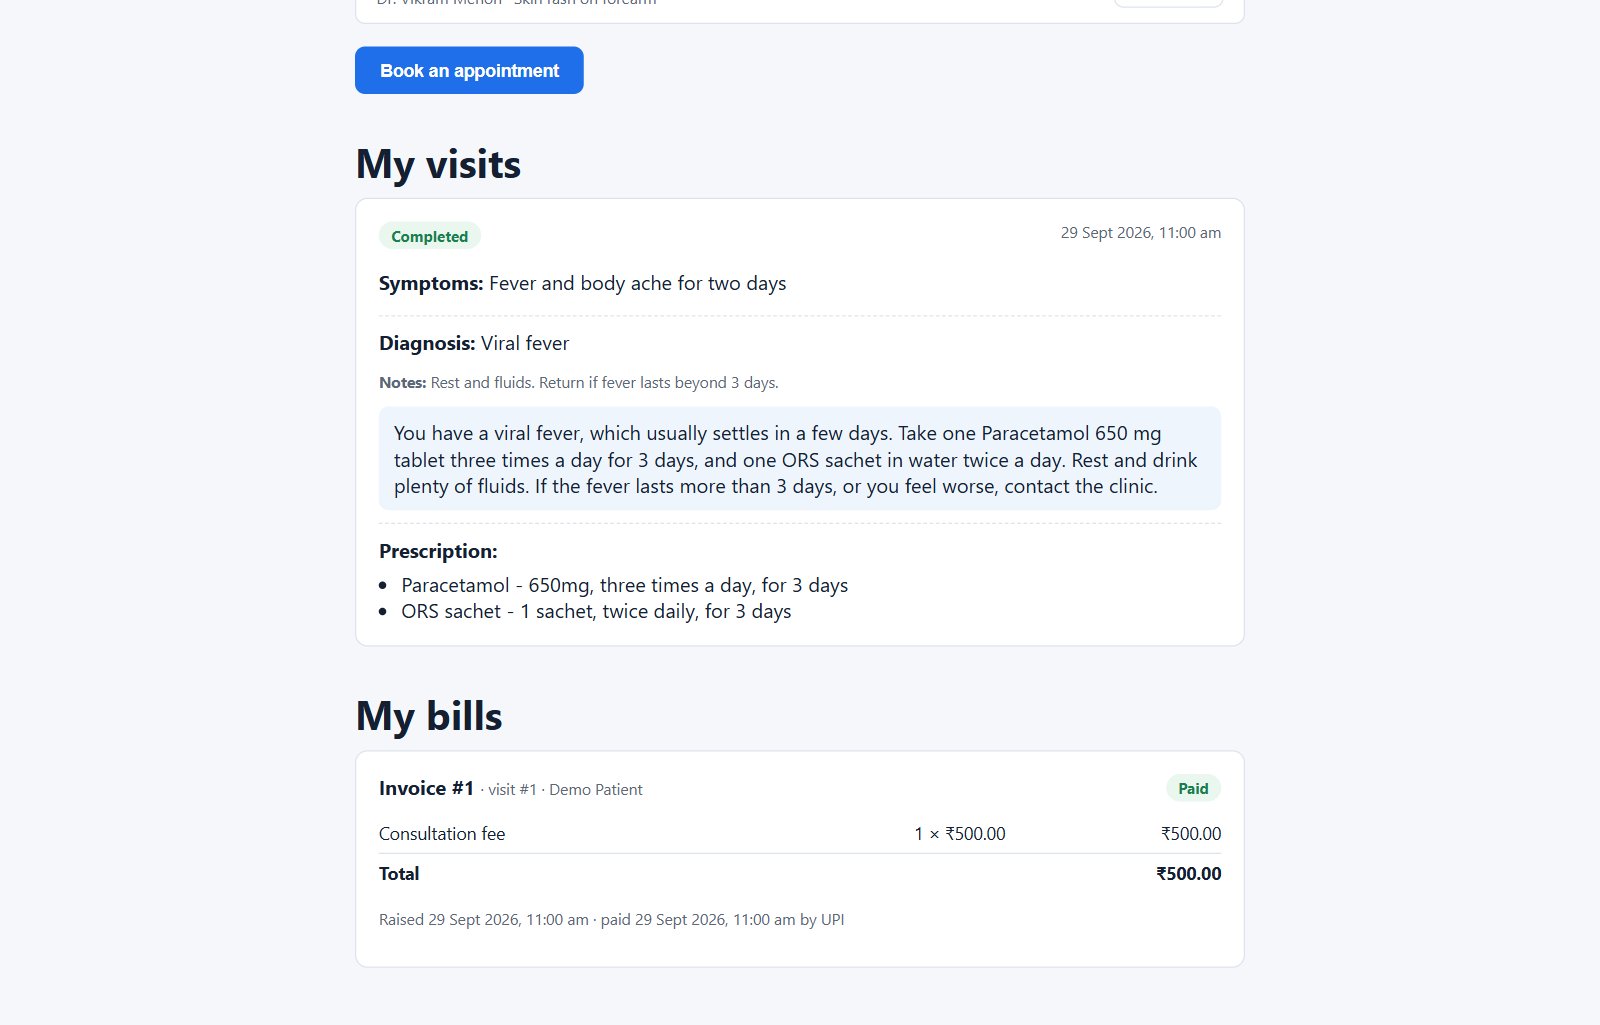
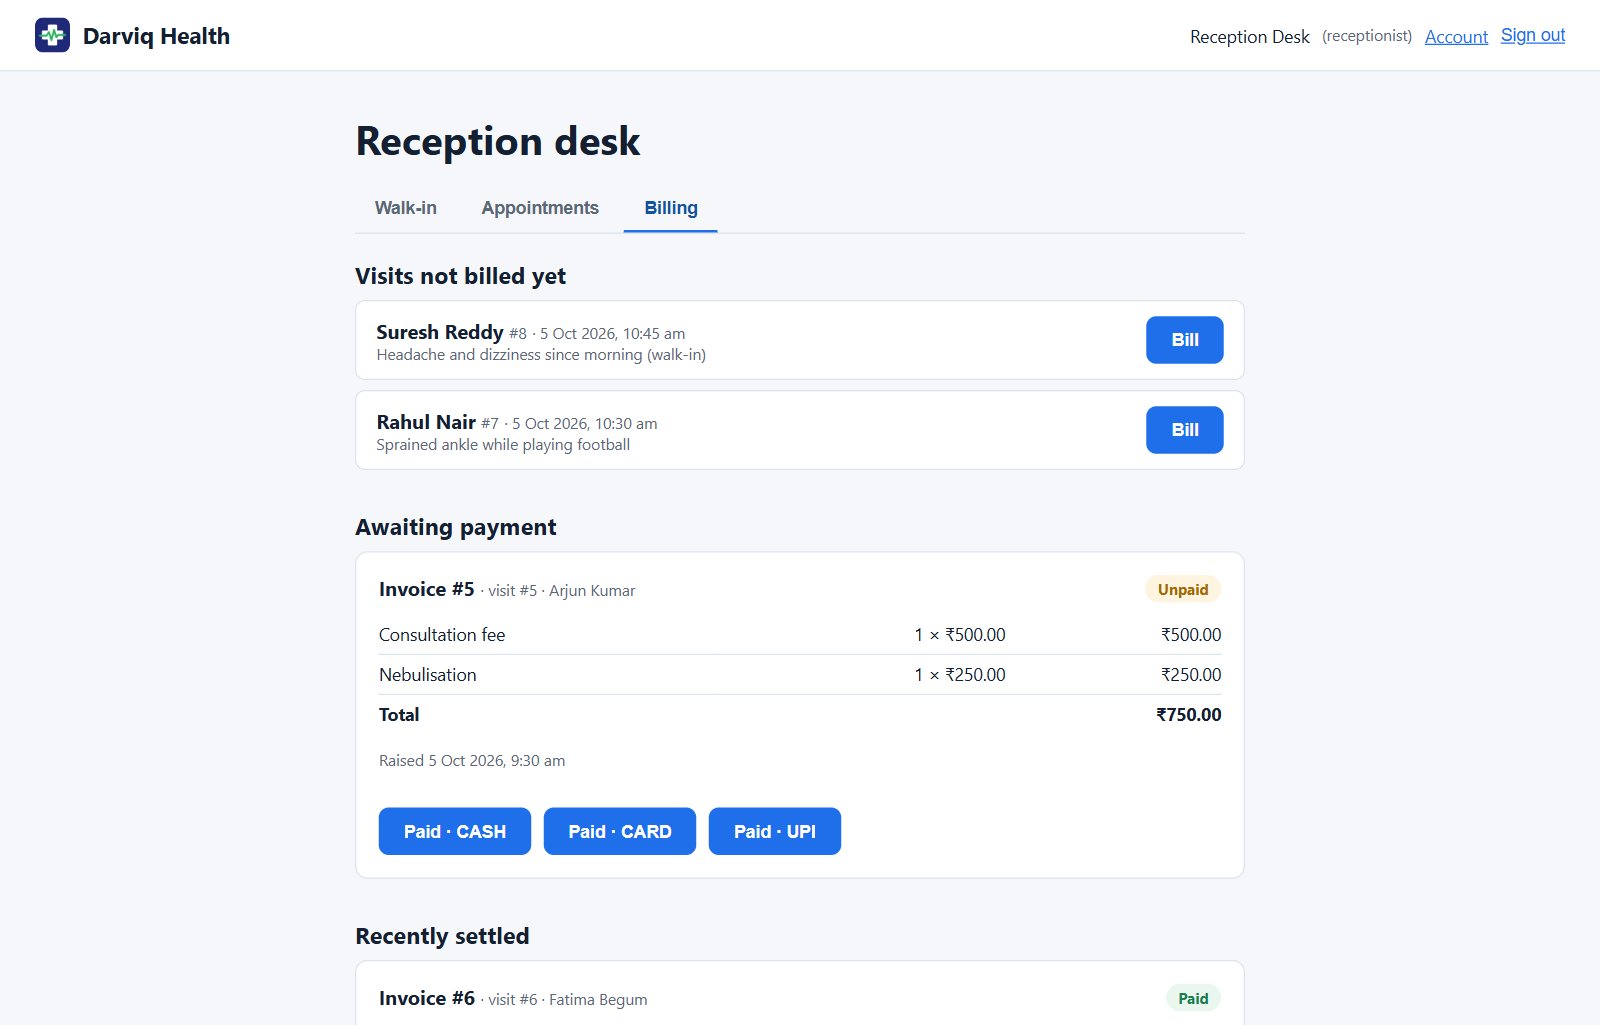
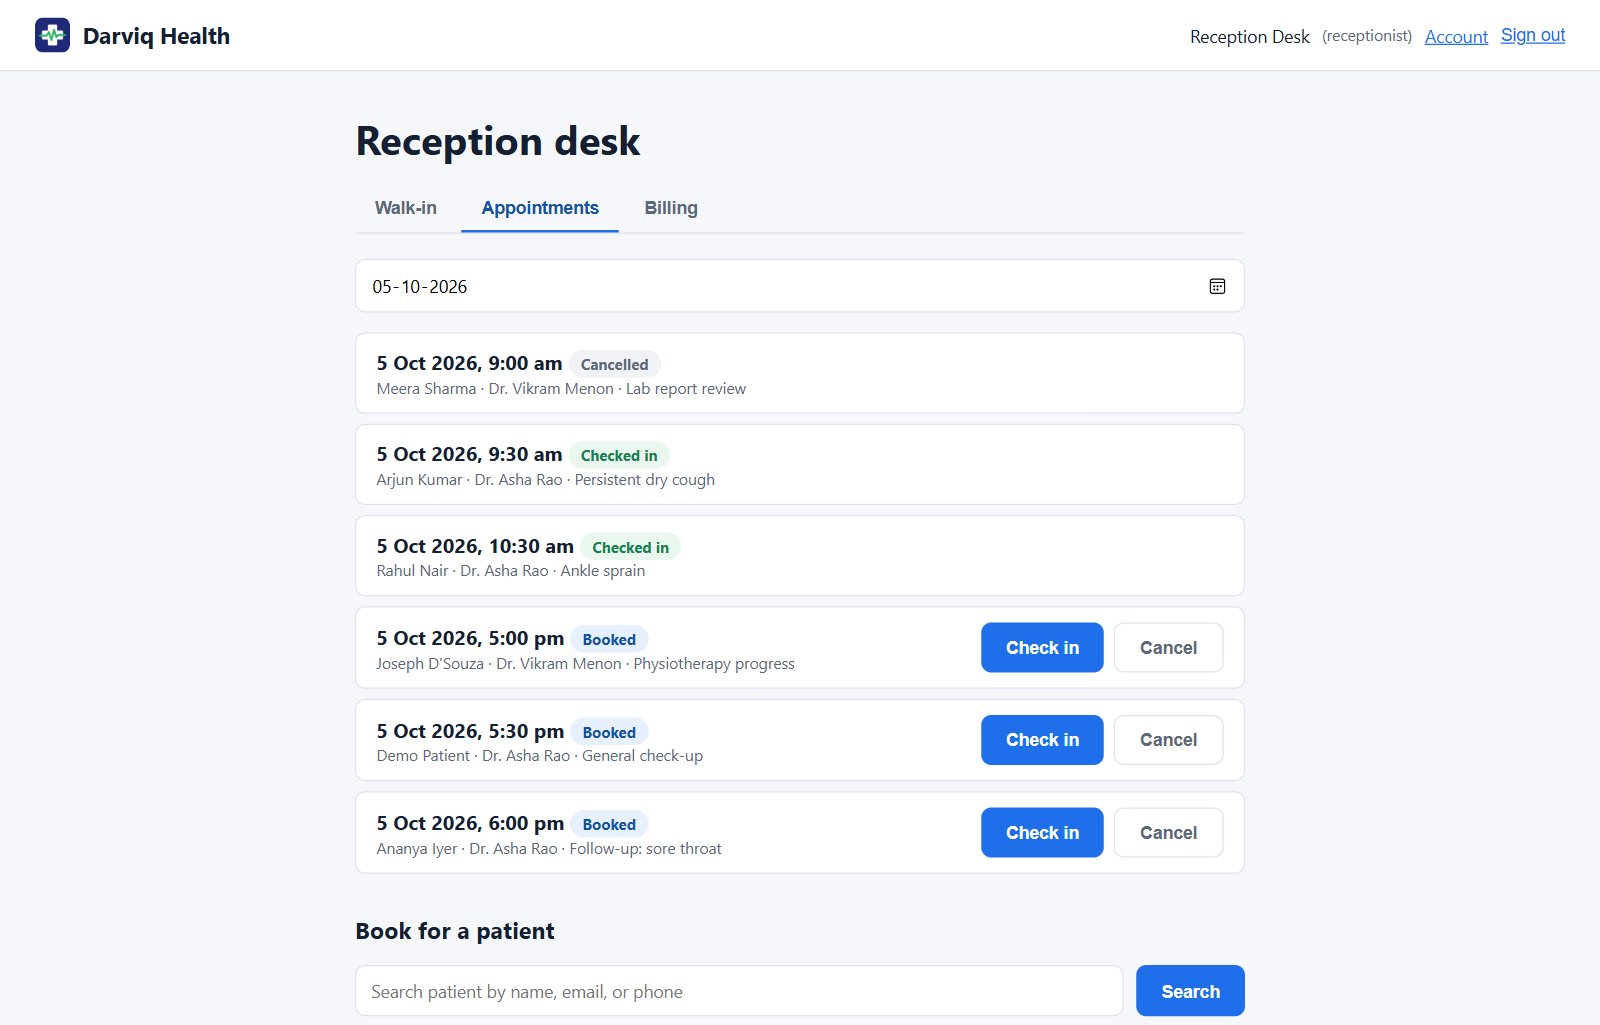
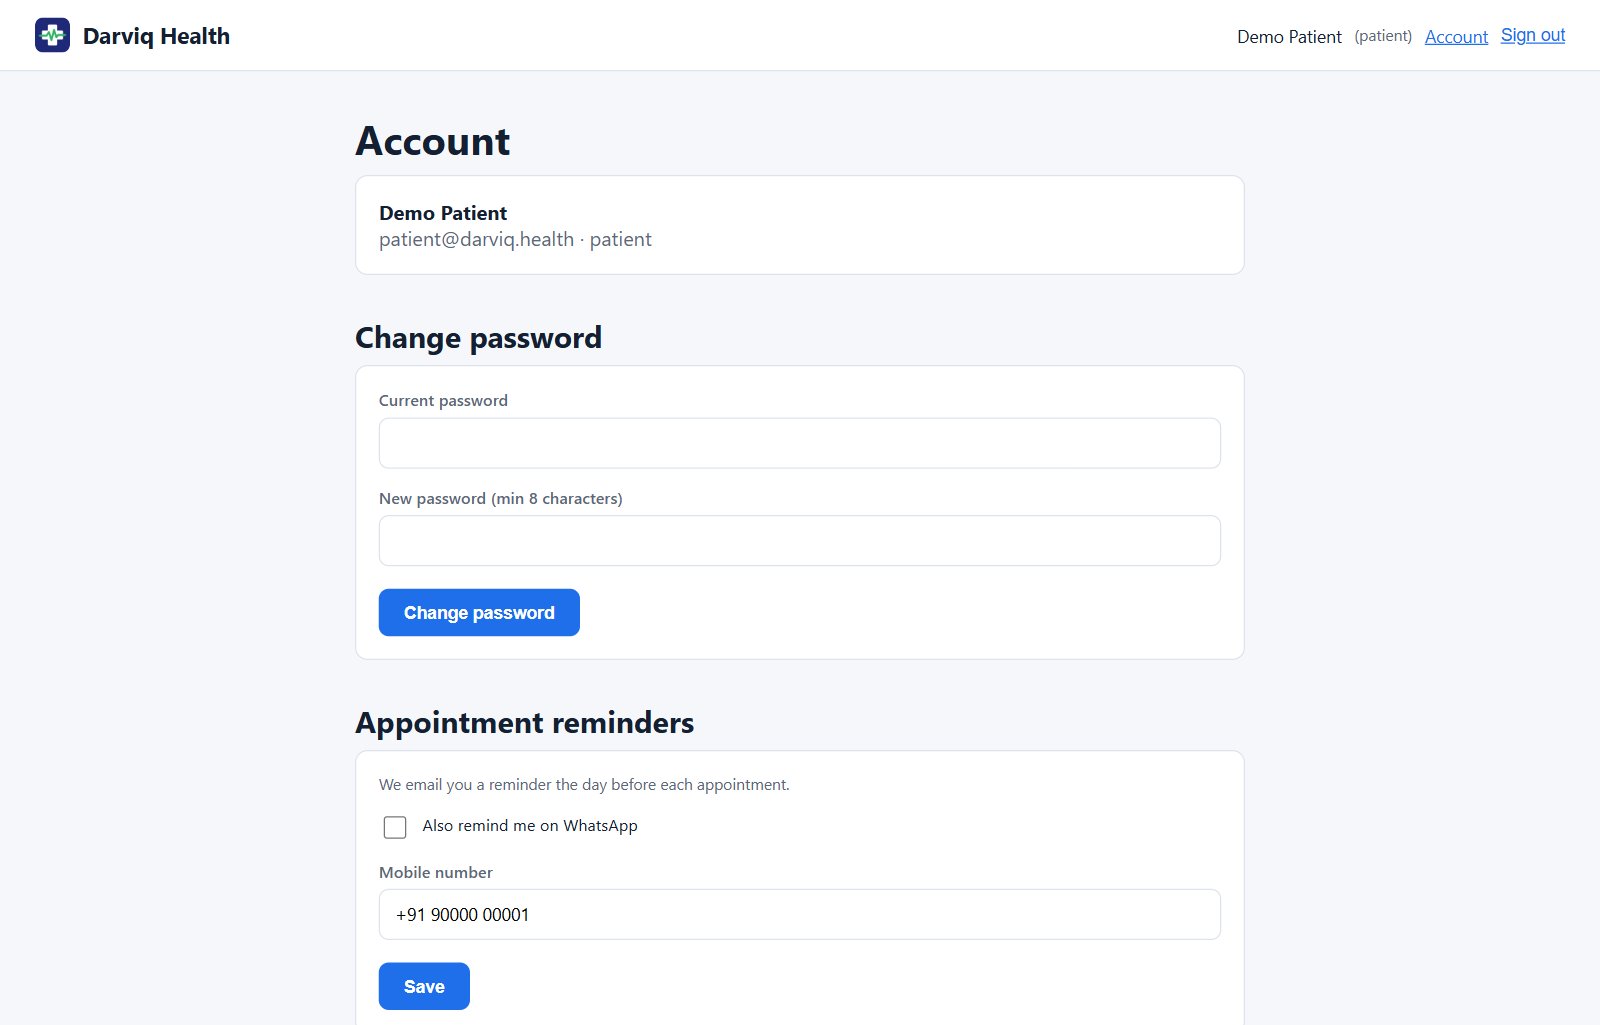
Screenshots use invented sample data. Click a screenshot to enlarge it.
Built: appointments with email and WhatsApp reminders, registration, consultation, prescriptions, billing and AI drafting for doctors, with an automated test suite covering every role and workflow rule, and an Android app ready for Google Play testing. Next: lab orders, pharmacy stock and online payments.
Patient data: pilots run on sample data. Before any clinic stores real patient records, the deployment adds what India's DPDP Act requires: consent records, encryption, audit logs and hosting in an Indian region.
The backend of a social network, built as 11 services to work through the problems large platforms face.
Separate follow and friend graphs; accepting a friend request follows both ways. Reactions, comments, reposts, hashtags and 24-hour stories sit on top.
Each post is fanned out to followers' timelines through RabbitMQ when it's written, so reading a feed is a single fast lookup.
PostgreSQL for users, notifications and media, where flexible queries matter. Cassandra for graphs, posts, feeds and messages, which are write-heavy.
Prometheus metrics and Alertmanager rules across all 11 services, with alerts tested by stopping services on purpose. Includes Kubernetes manifests, a Jenkins pipeline and Terraform for Amazon EKS.
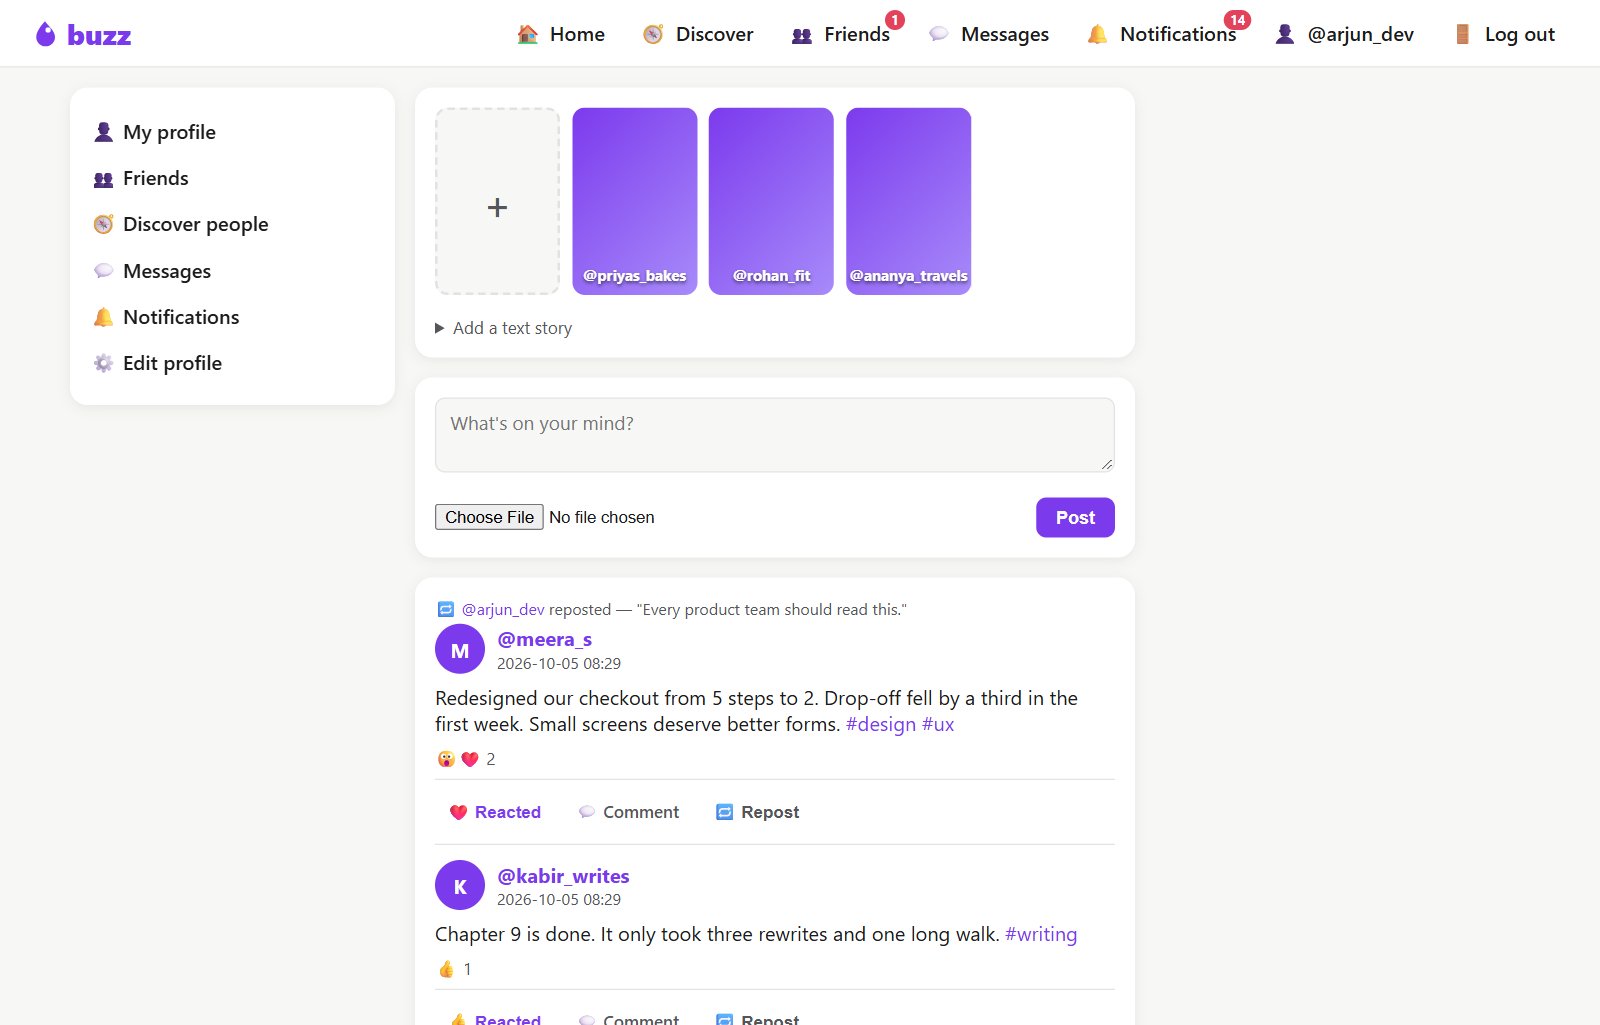
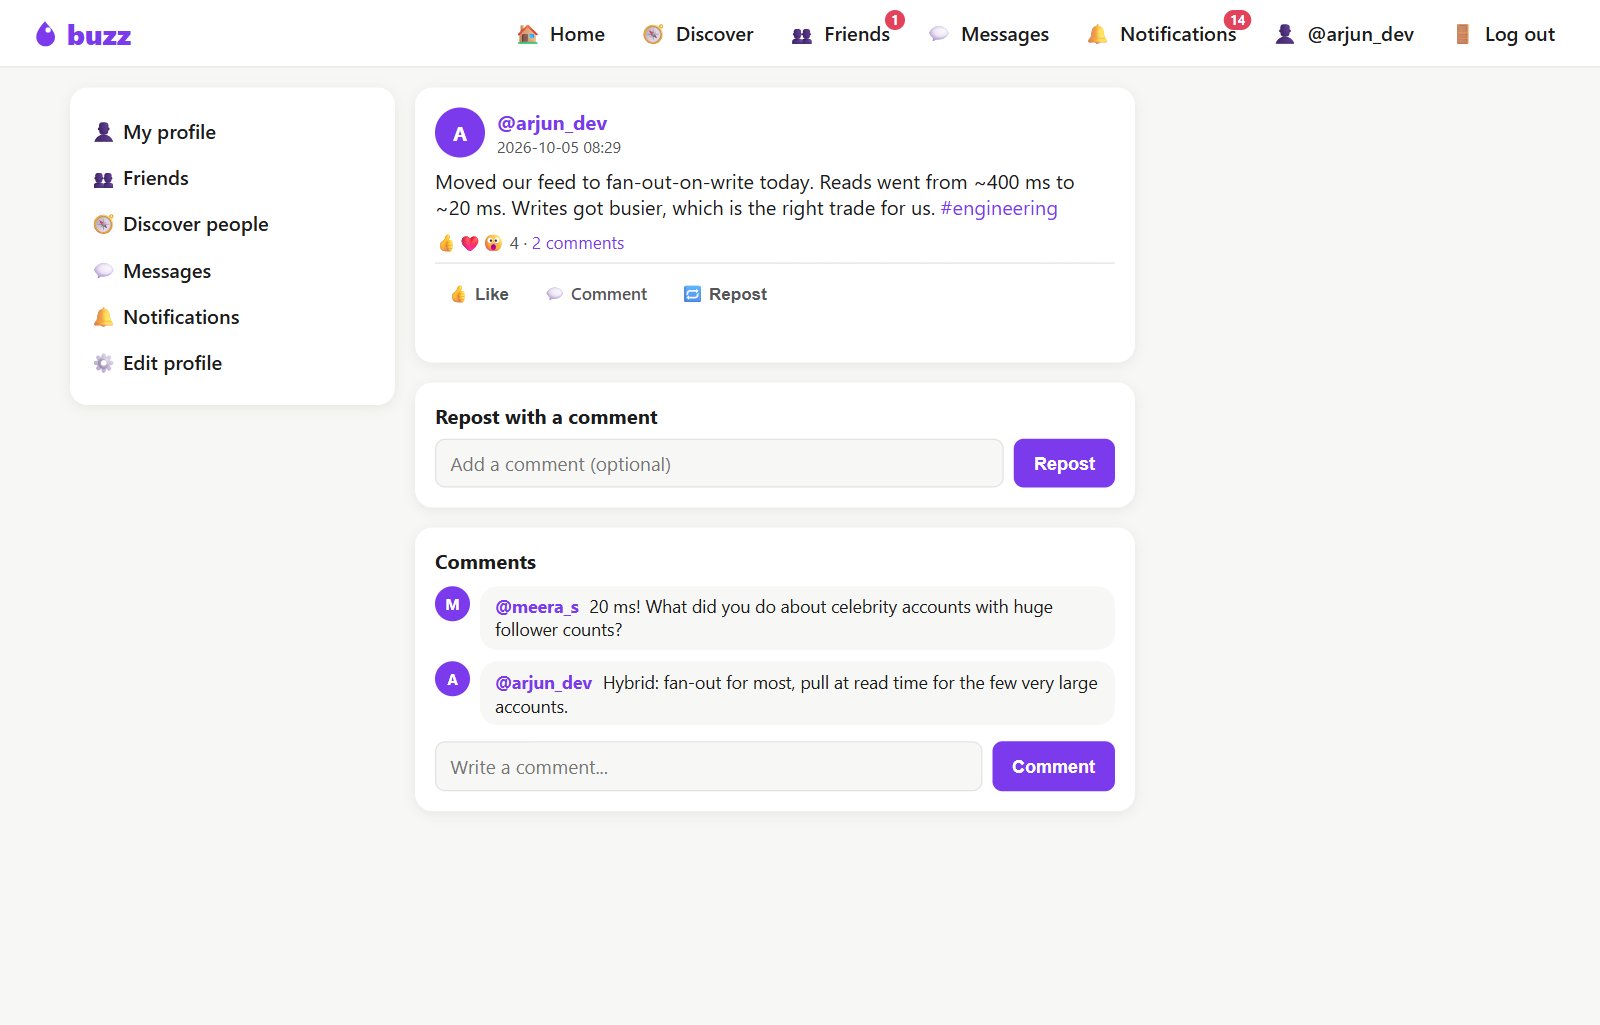
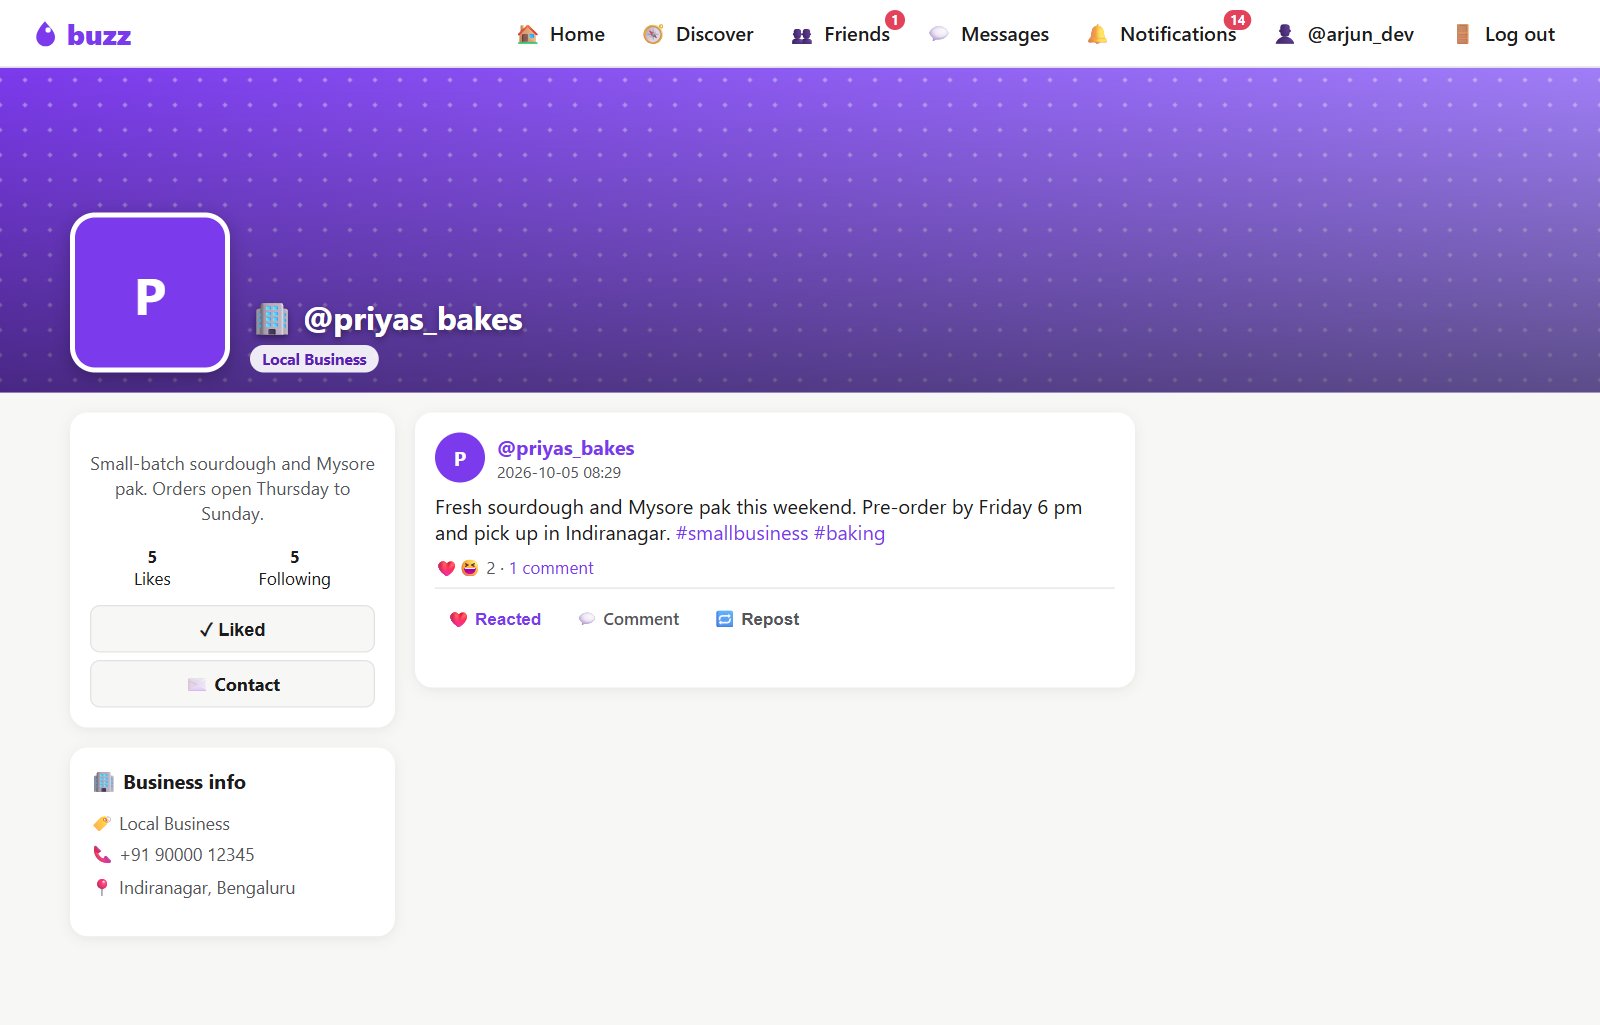
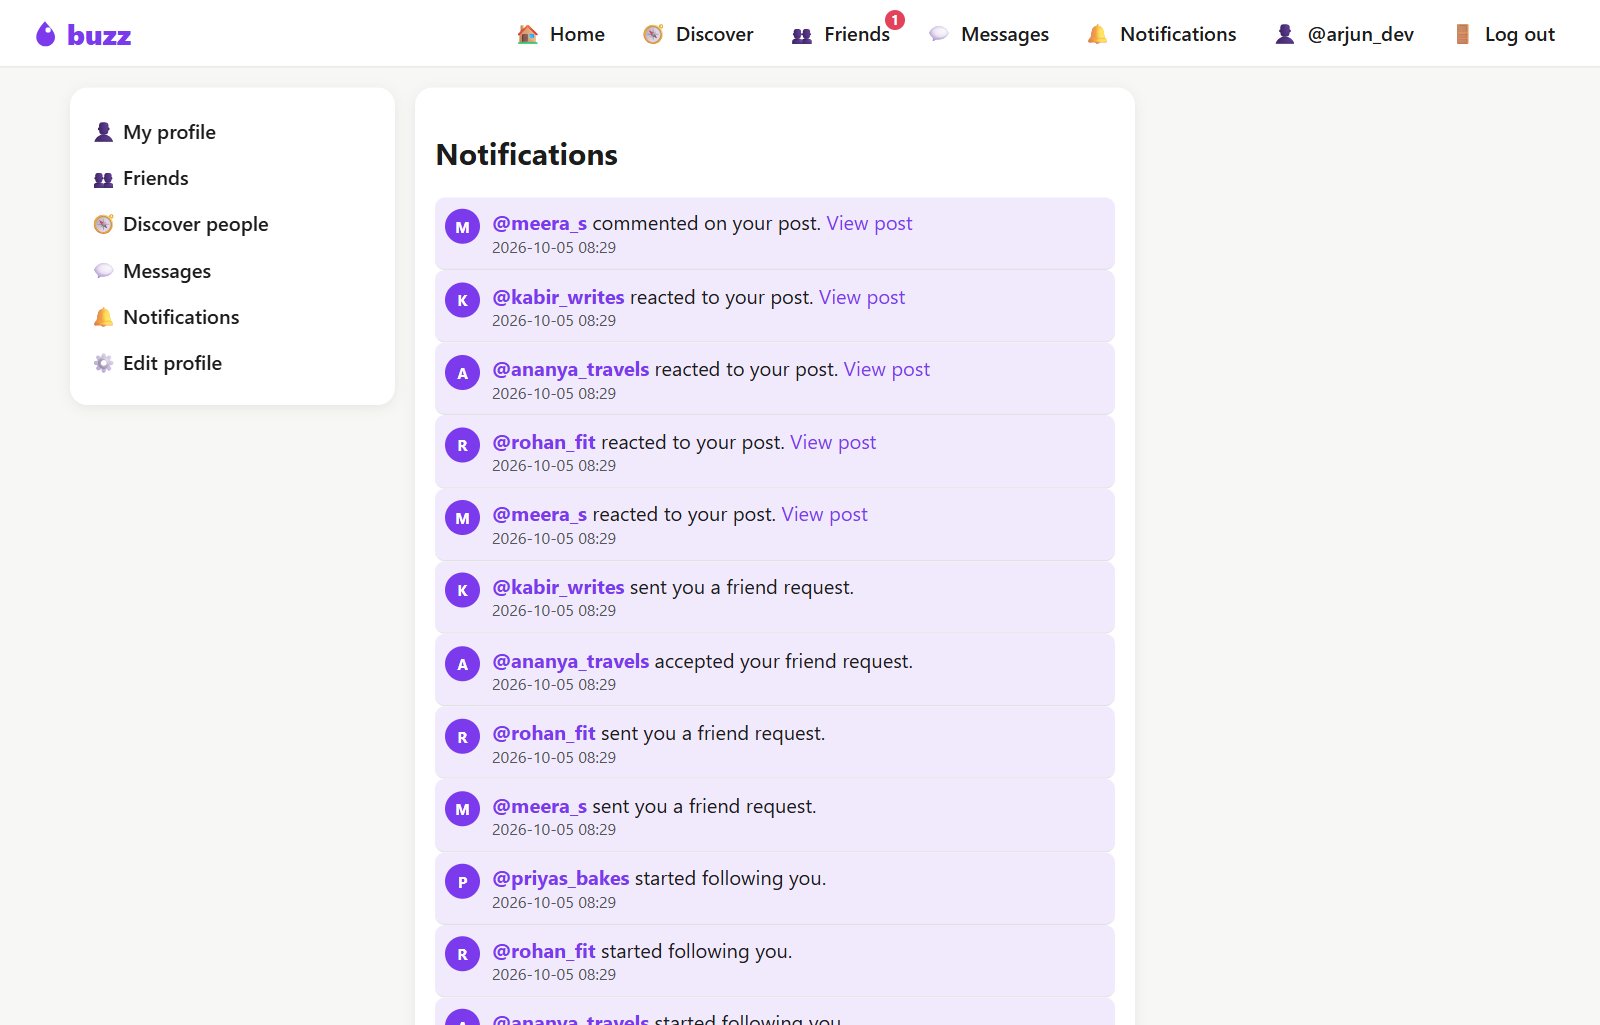
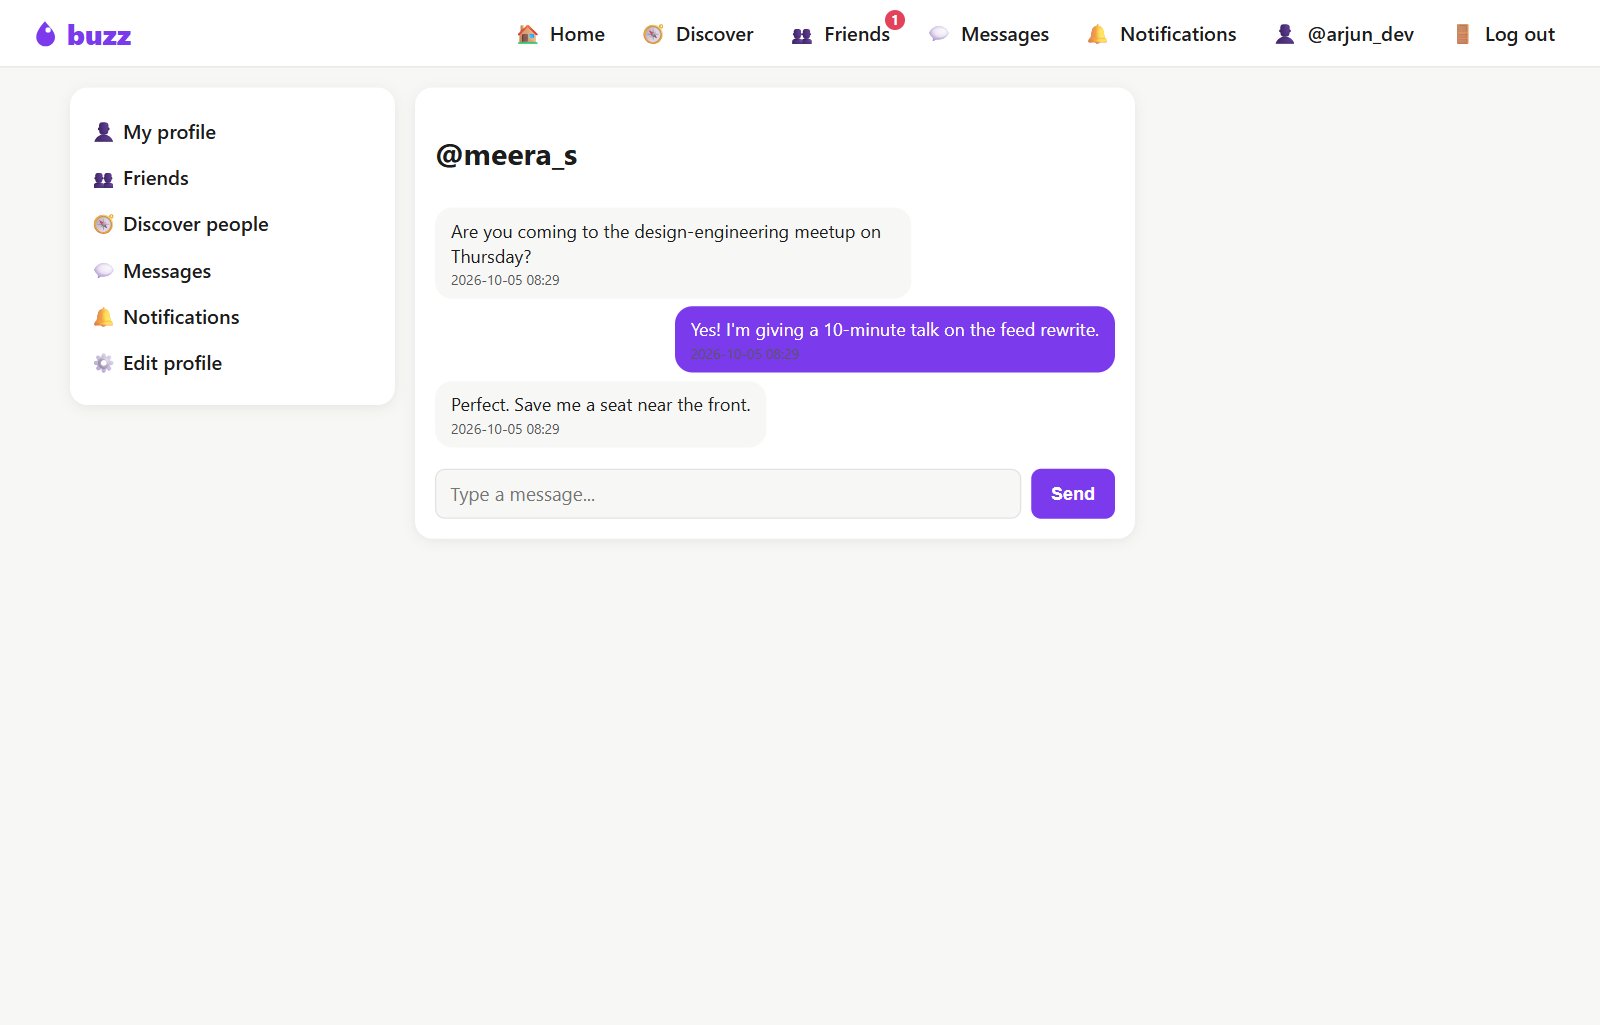
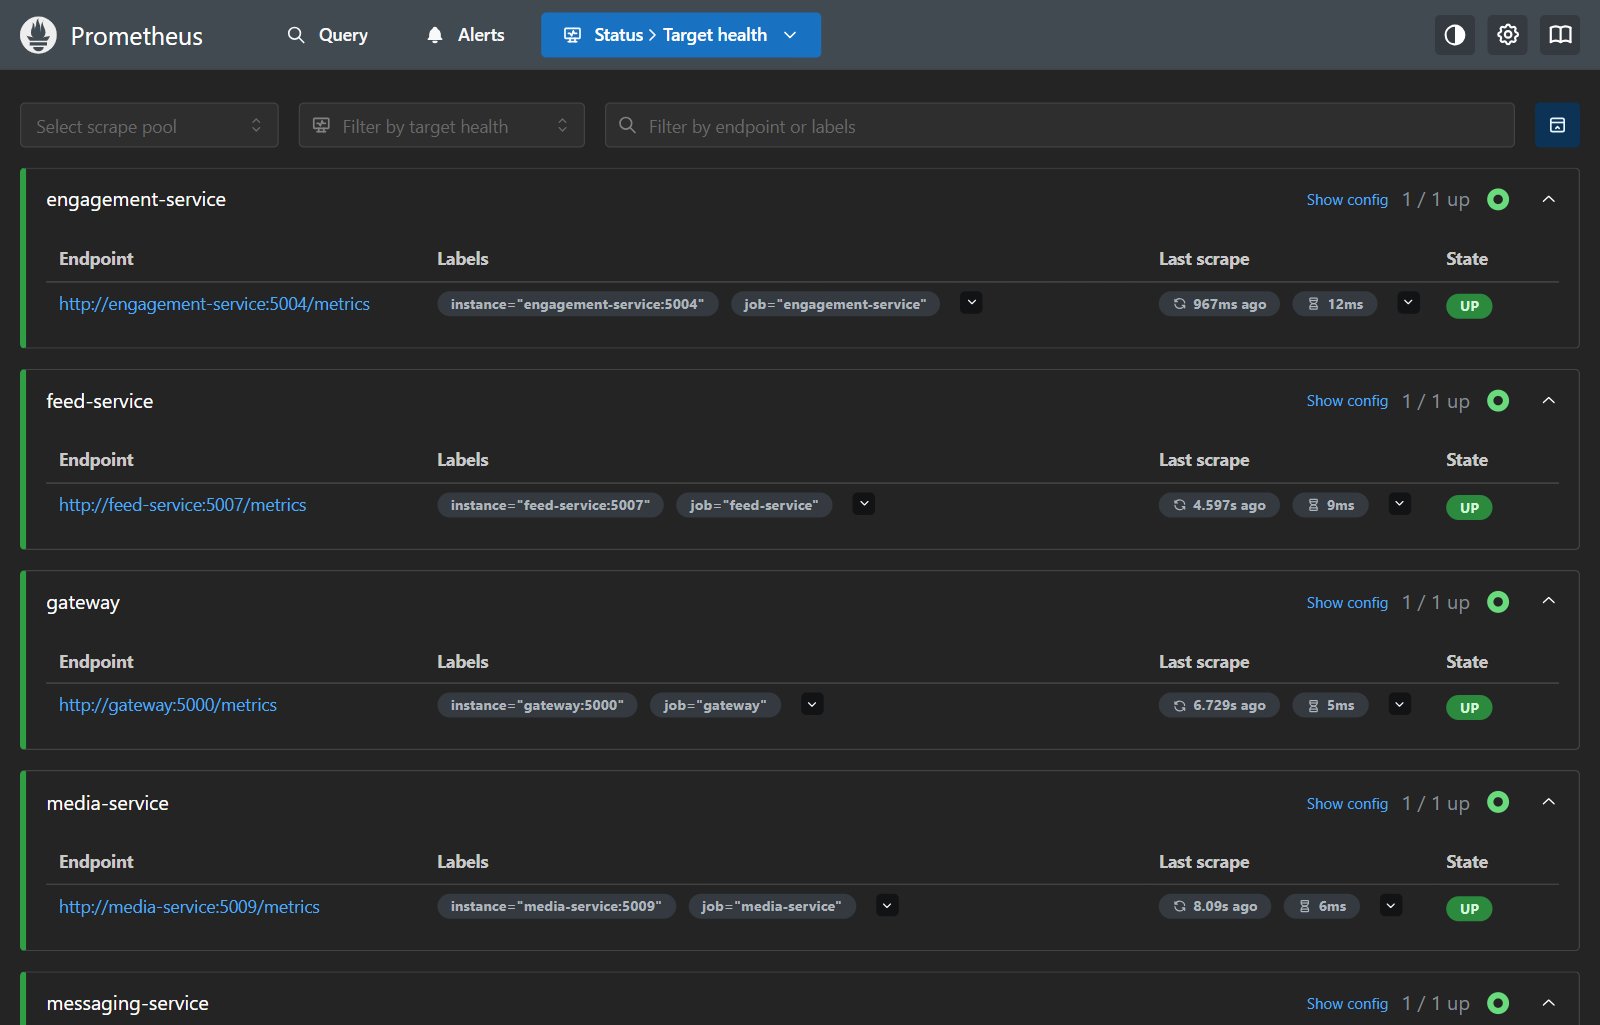
Screenshots use invented sample people and posts. Click a screenshot to enlarge it.
A simulated humanoid that stands under its own joint-torque control and recovers from a push, running on MuJoCo's rigid-body physics.
Segment masses and lengths come from the standard published human anthropometric table, so changing the height or weight regenerates a consistent body.
A plain joint controller can't even keep the body standing: it tips over within seconds. A hand-designed ankle strategy, written as real joint-torque control, feeds the body's balance back into the ankles and survives a 400 N forward push.
A 195-parameter neural network, trained with evolution strategies on 8 pushes, picks its own ankle and hip corrections. From behind it survives 300 N straight back and 400 N from back-right, where the hand-designed controller manages 100 N, including a direction it never trained on.
24 automated tests check the body model and all three controllers, including the cases where the learned one loses.
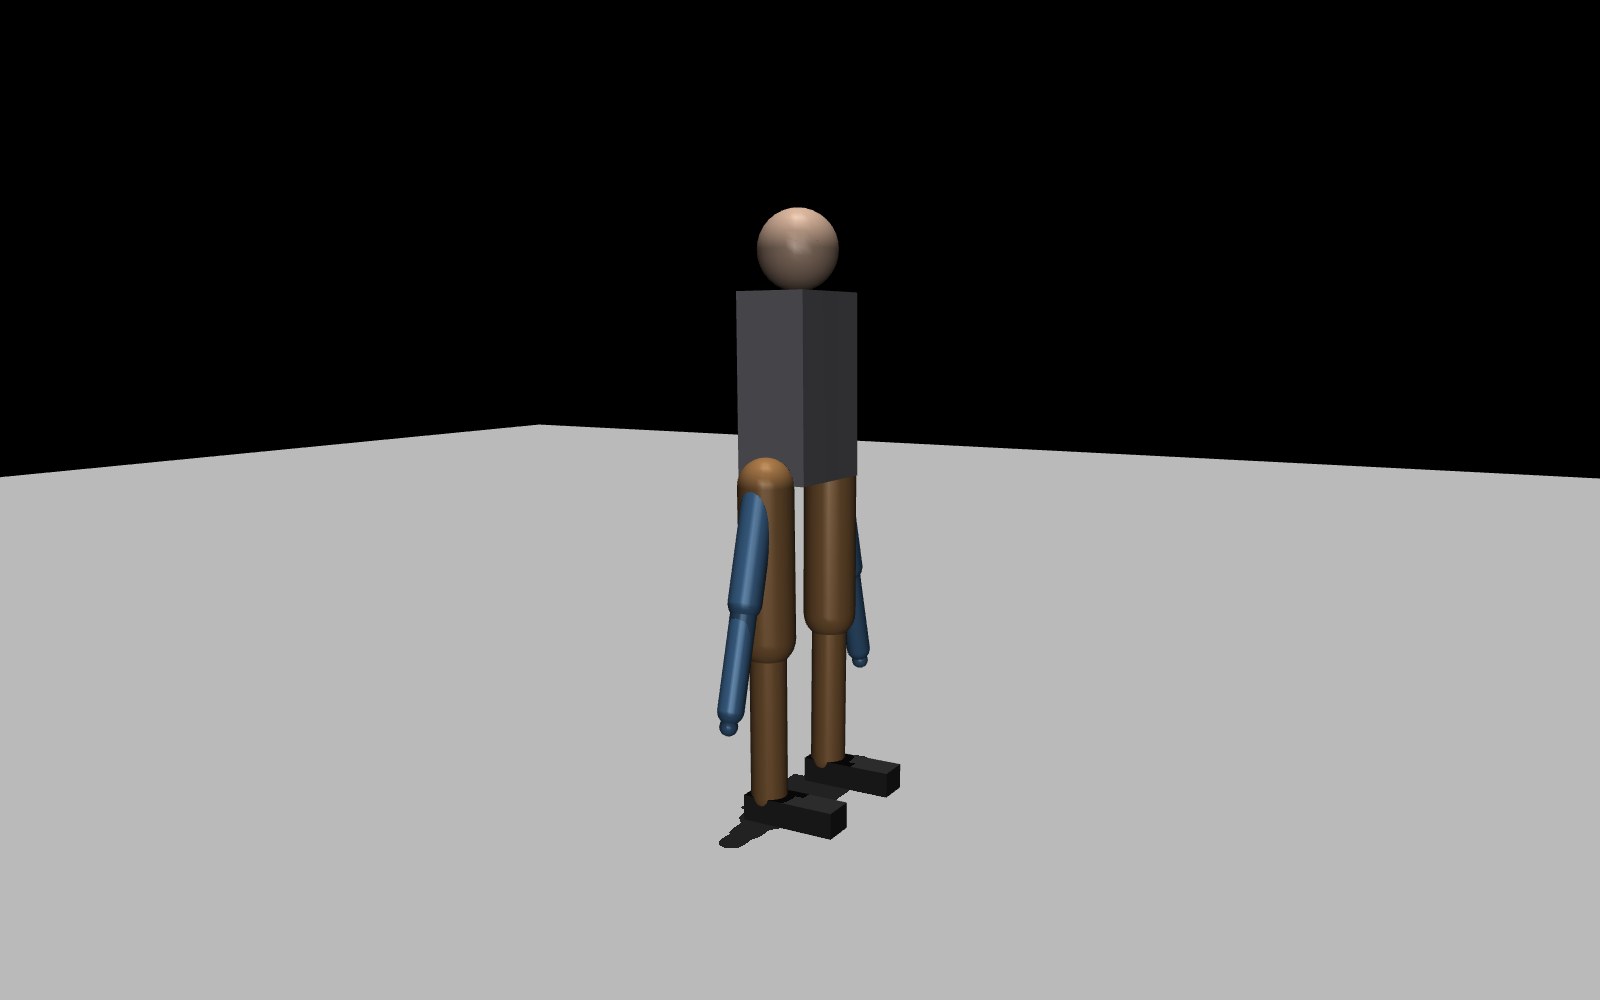
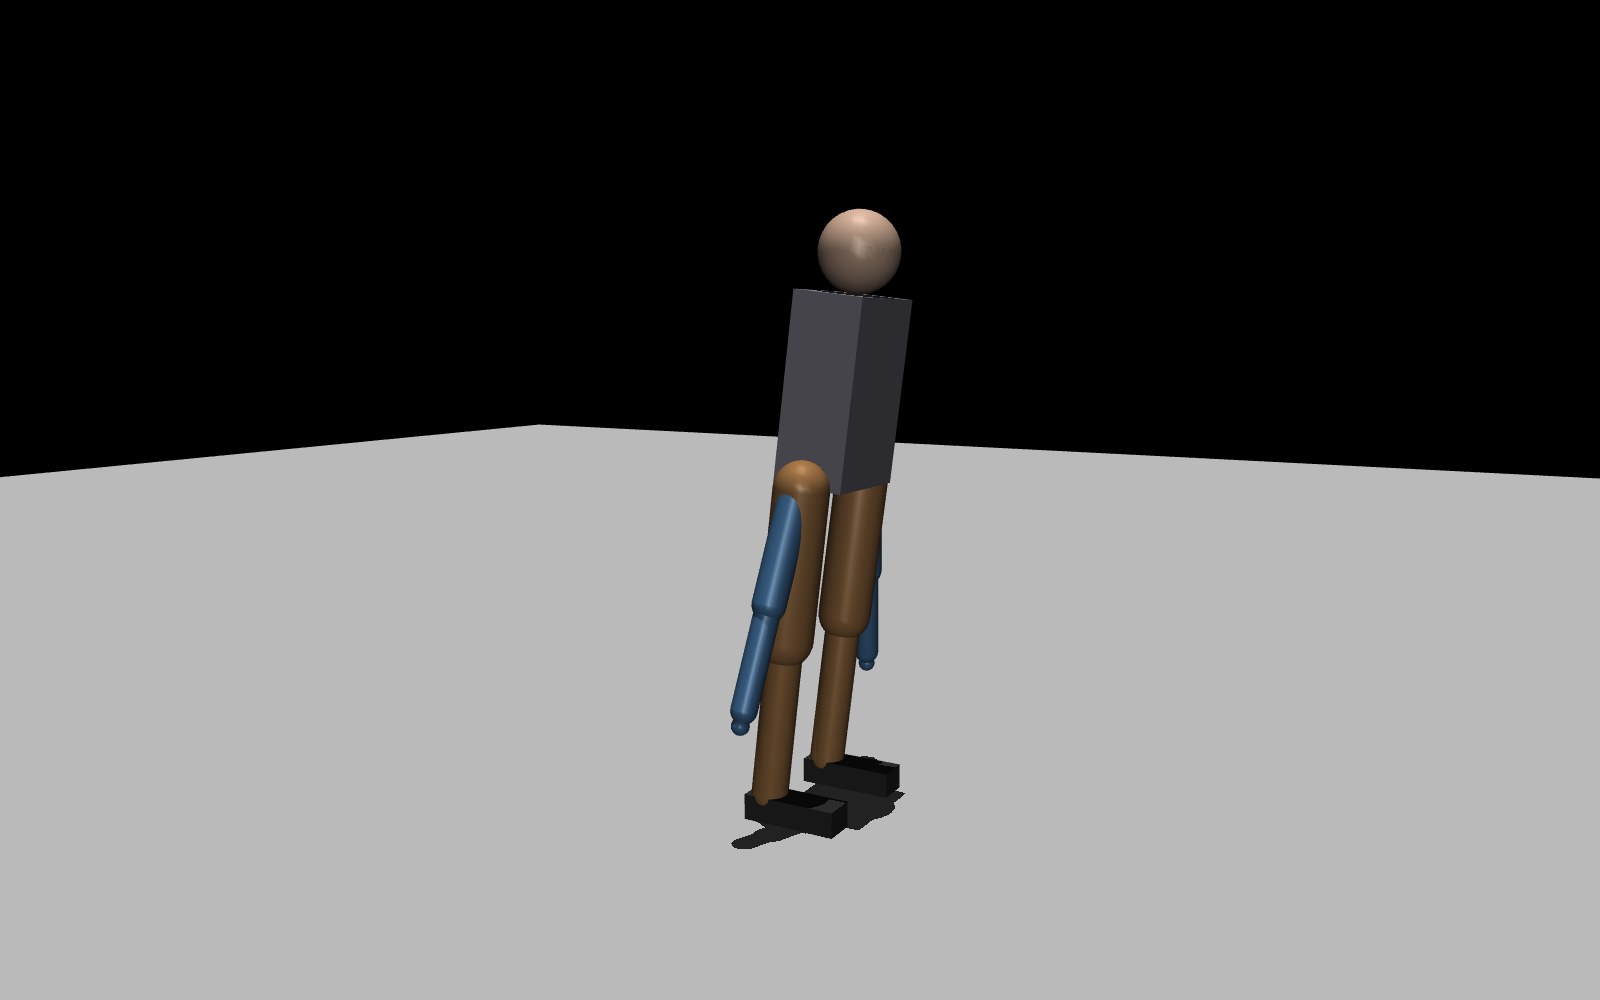
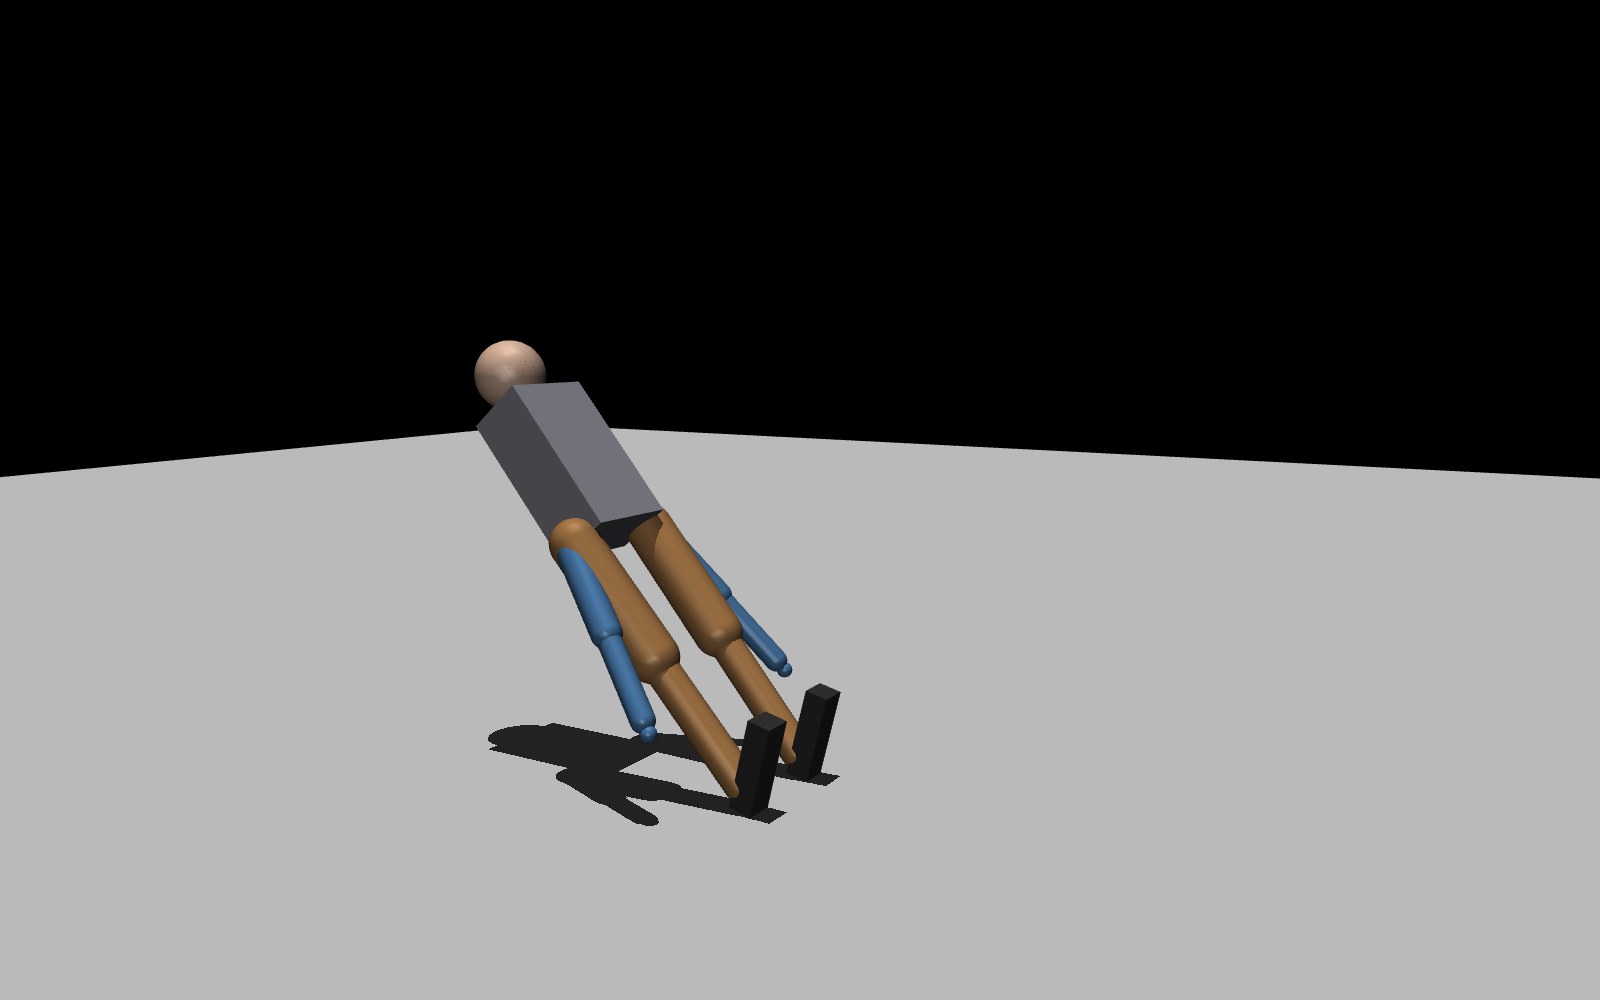
Rendered from the real MuJoCo simulation, not illustrations. Click a screenshot to enlarge it.
Across 96 test pushes in 8 directions the learned controller survives 18 and the hand-designed one 17: much better from behind, worse from the front, and lopsided left to right. Next: a mirror-symmetric policy.
One application, built to deploy the same way to Amazon EKS, Azure AKS and Google GKE. Each cloud gets its own Terraform; the Kubernetes setup is shared, with a thin layer for what genuinely differs.
Private worker nodes across two zones behind a NAT gateway, EBS storage with its own IAM role, network policies enforced, metrics-server for autoscaling, images in ECR with scanning.
Nodes across three availability zones in a dedicated virtual network with Azure CNI Overlay, managed identity instead of passwords, Entra ID sign-in with Azure RBAC, images in ACR.
Autopilot cluster on a VPC-native network, Dataplane V2 network policies, images in Artifact Registry.
Replicas spread across zones, health checks, autoscaling, a disruption budget for node upgrades, a locked-down container and default-deny network policies. Every change is checked automatically for all three clouds. The EKS design is shared with Darviq-Buzz, whose deploy is rehearsed end to end on a local cluster; the AKS and GKE stacks are validated in CI.
Automated monitoring for cloud workloads, entirely as code, across the tools teams actually run: Prometheus and Grafana, Loki, Zabbix, Datadog and Splunk. It watches Darviq-Buzz, Darviq-Nyaya, the Darviq-Health API, the host and every container, and darviq.com from the outside, and every tool's alerts land on one on-call page.
Metrics from every service, host and container. Four Grafana dashboards (38 panels) are generated from code, and adding a service to monitoring means adding one JSON file. 13 alert rules, each with a runbook and unit tests that also prove look-alike cases stay quiet.
Grafana Alloy collects every container's logs into Loki, labelled by project and service, with levels detected automatically. Search them next to the metrics, and alert when errors spike or stack traces appear.
Zabbix 7 with agent 2 on the Docker host, configured entirely through its API by a script: Zabbix's own Linux and Docker templates discover every container, web scenarios check each site with down and slow triggers, and a webhook action sends problems to on-call.
The Datadog agent (containers, logs, the same metrics endpoints, HTTP checks) plus Terraform for six monitors mirroring the Prometheus alerts, synthetic tests of darviq.com from Mumbai and Ireland, and a dashboard. Validated in CI; it runs as soon as a Datadog account is connected.
Splunk Enterprise receives every container's logs through its HTTP Event Collector, with the index, log-level extraction, two alerts and a dashboard kept in the repo as a Splunk app. The dashboard groups repeated errors and names the exception behind each stack trace.
Prometheus, Loki, Zabbix, Datadog and Splunk all send alerts to the same receiver, which records each change once. In production that is Slack, email or PagerDuty; it doesn't matter which tool noticed first.
Stopping a service paged in 90 seconds and resolved when it came back. Stopping Nyaya's gateway was caught by Zabbix in 37 seconds and by Prometheus at 80. Stopping Buzz's database was caught by Splunk in 24 seconds, with the cause named on its dashboard, then by Loki and Prometheus, all on one page.
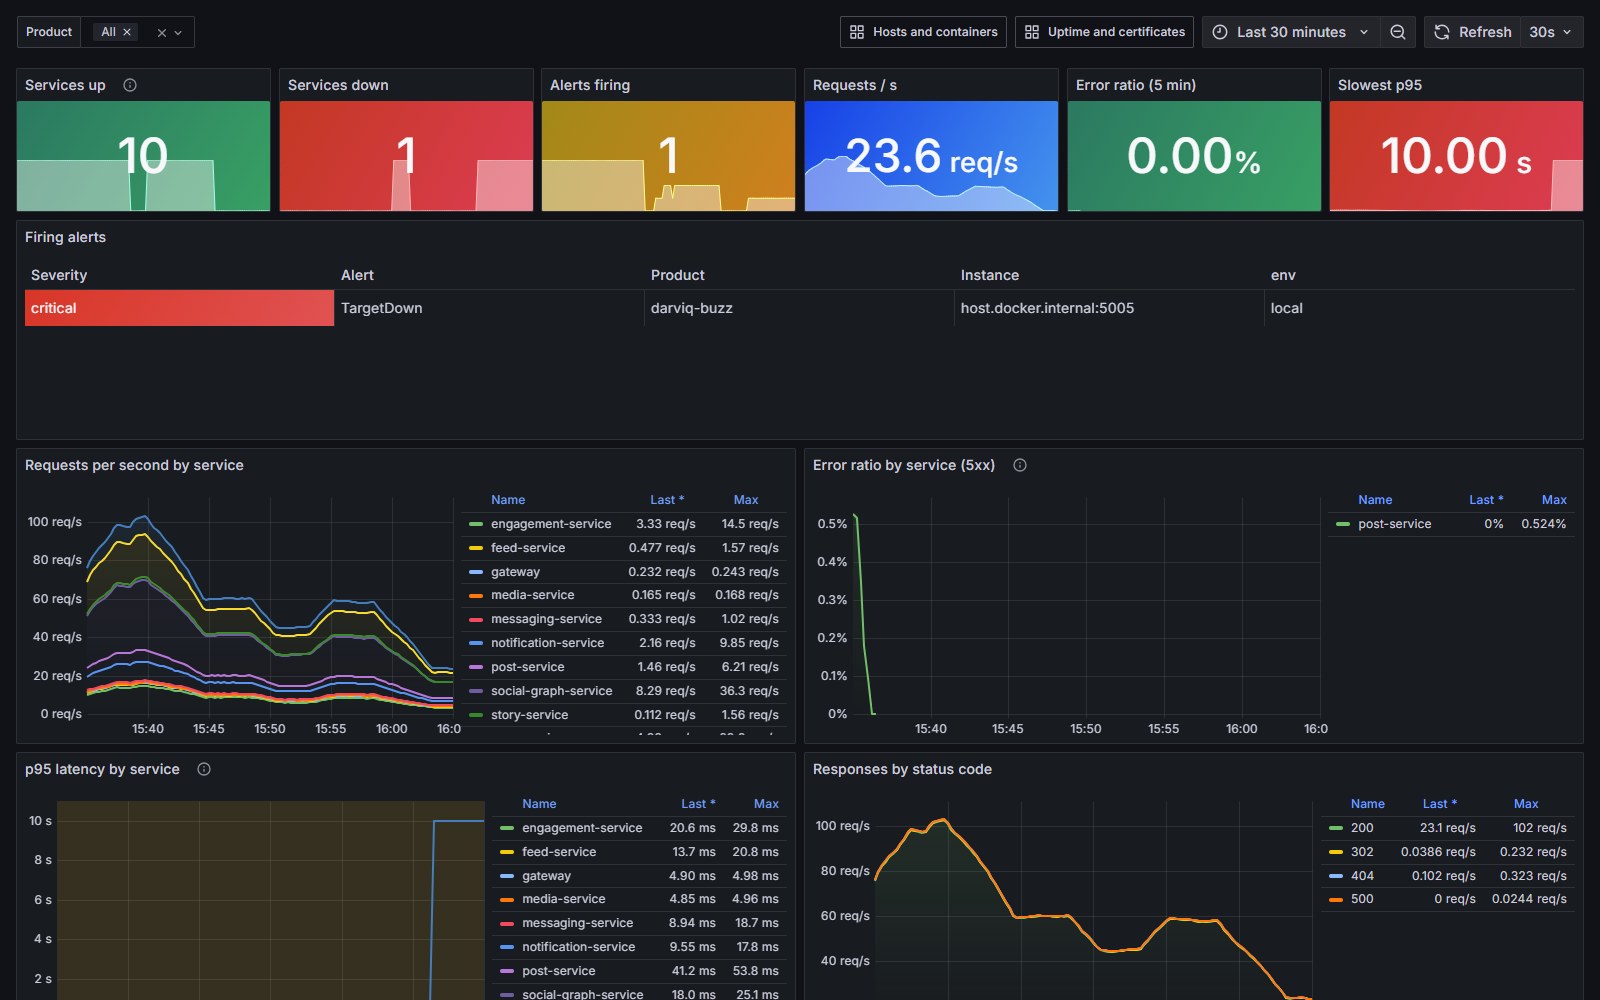
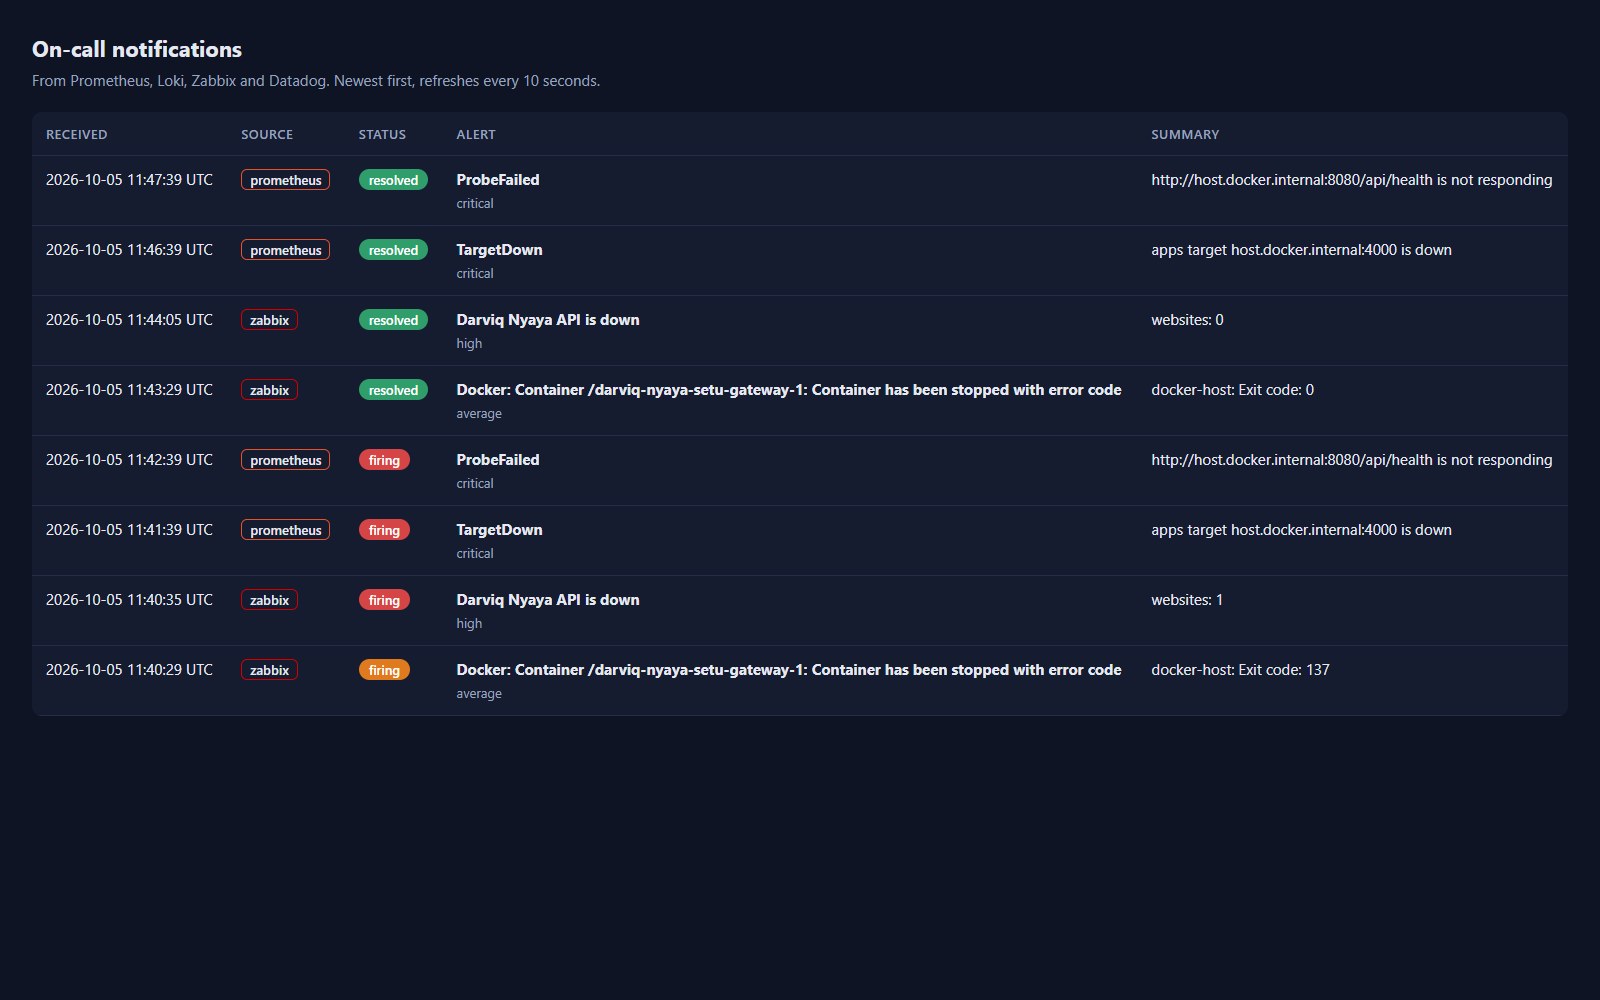
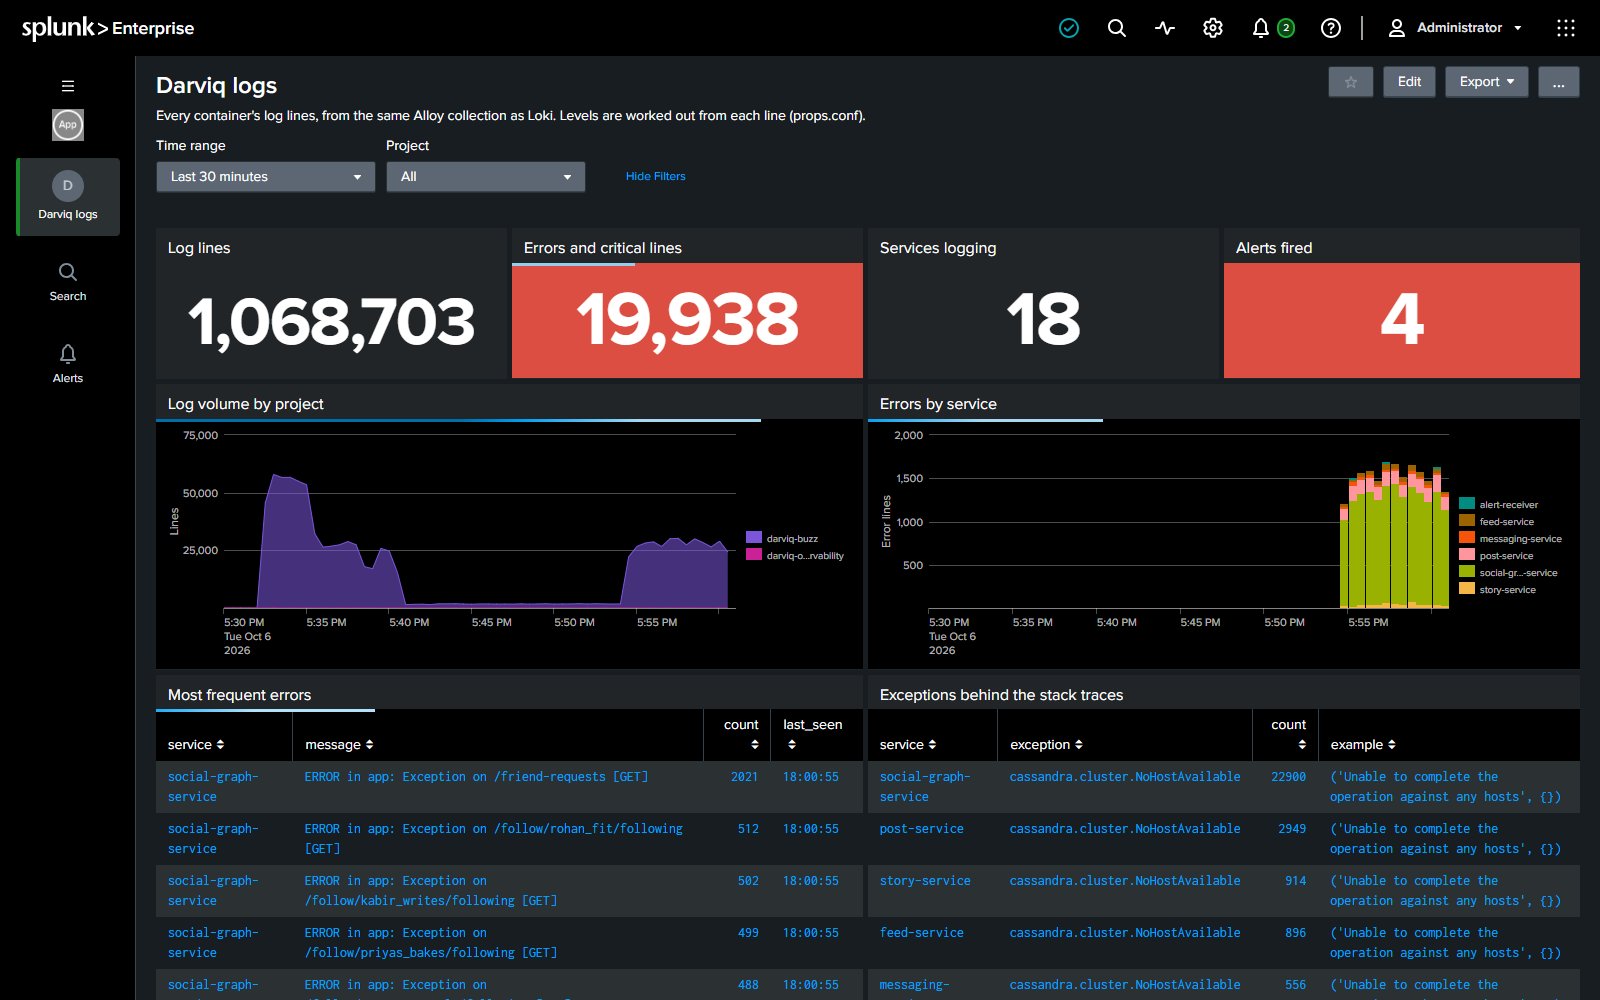
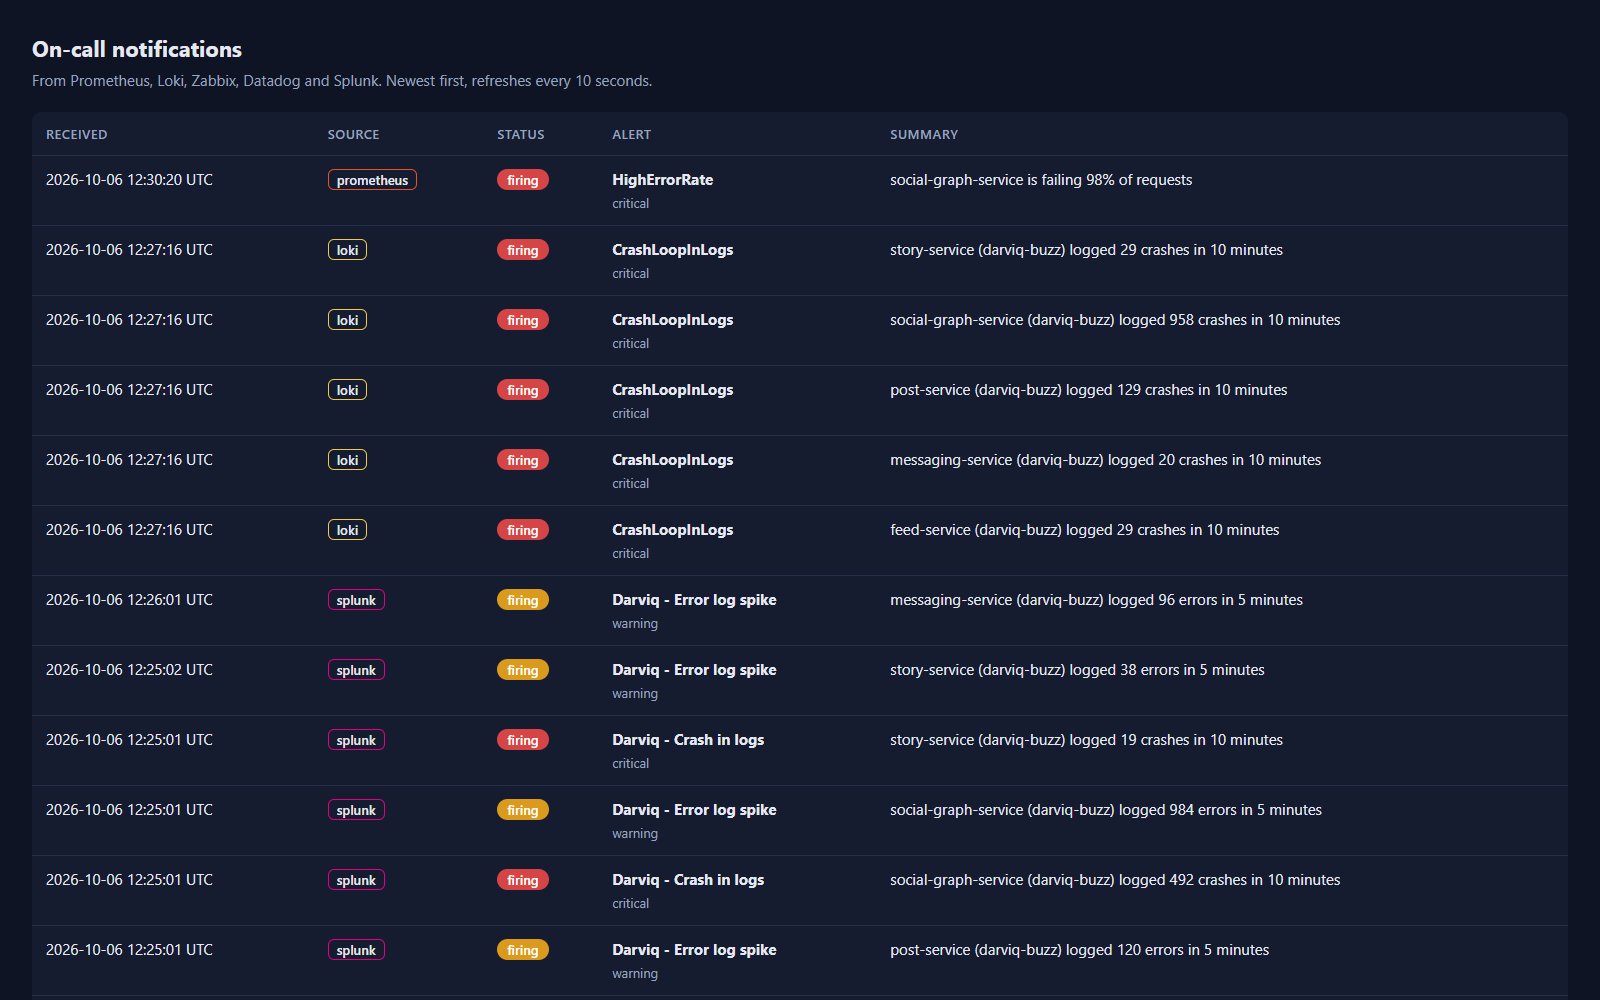
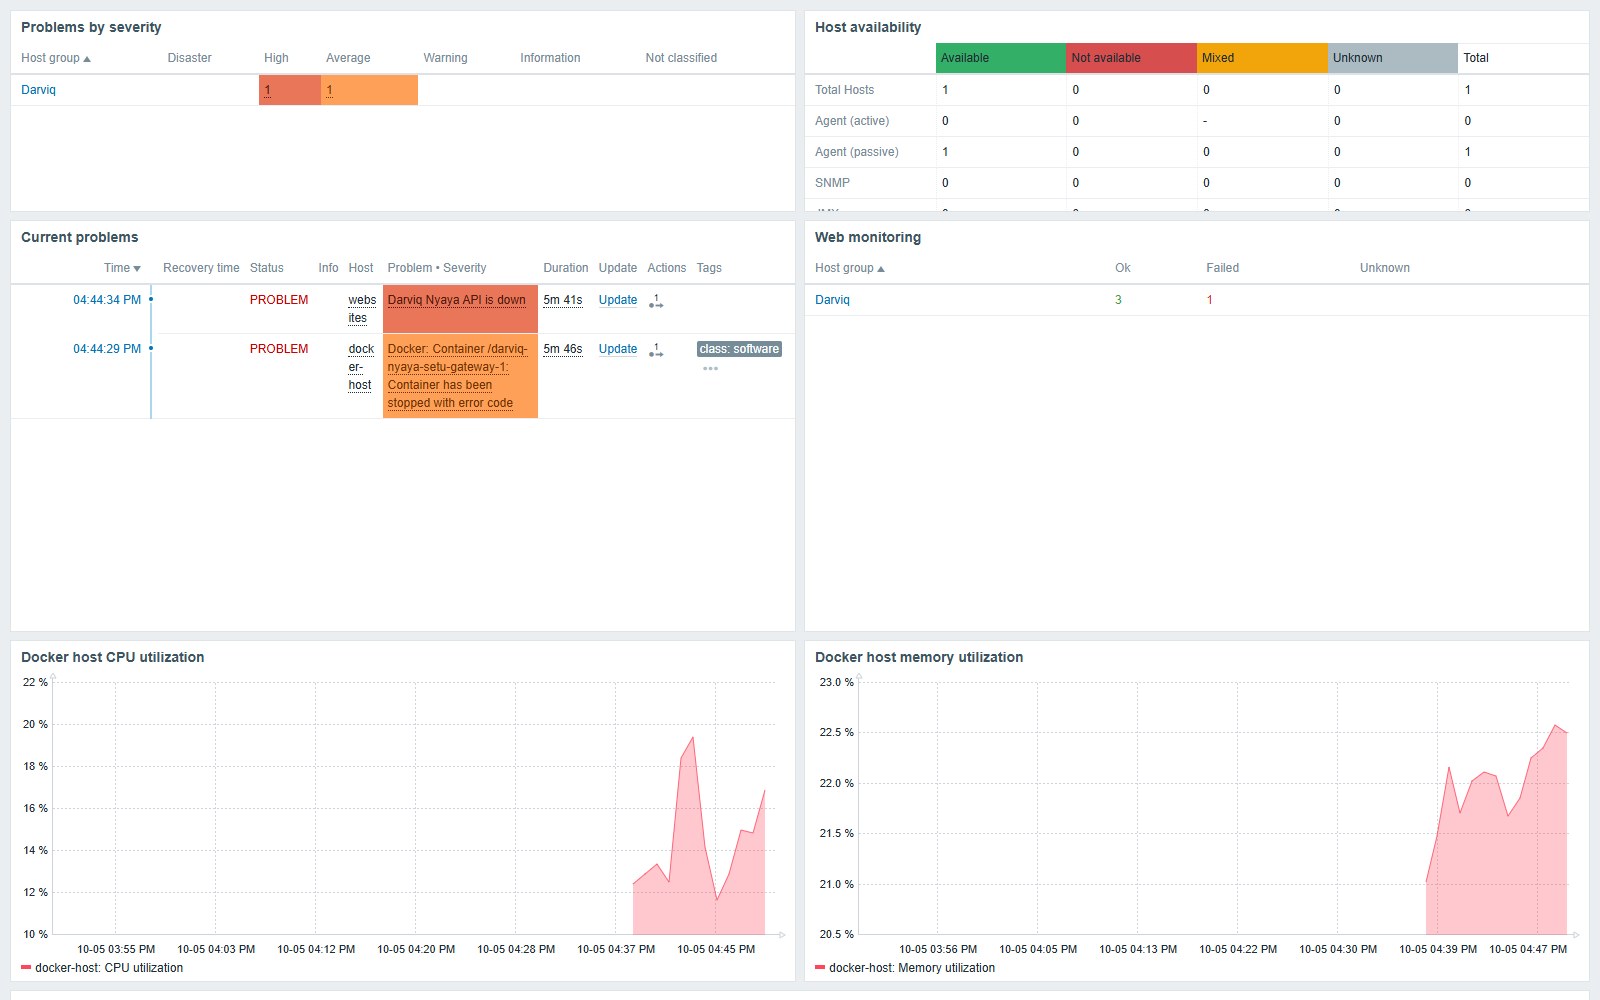
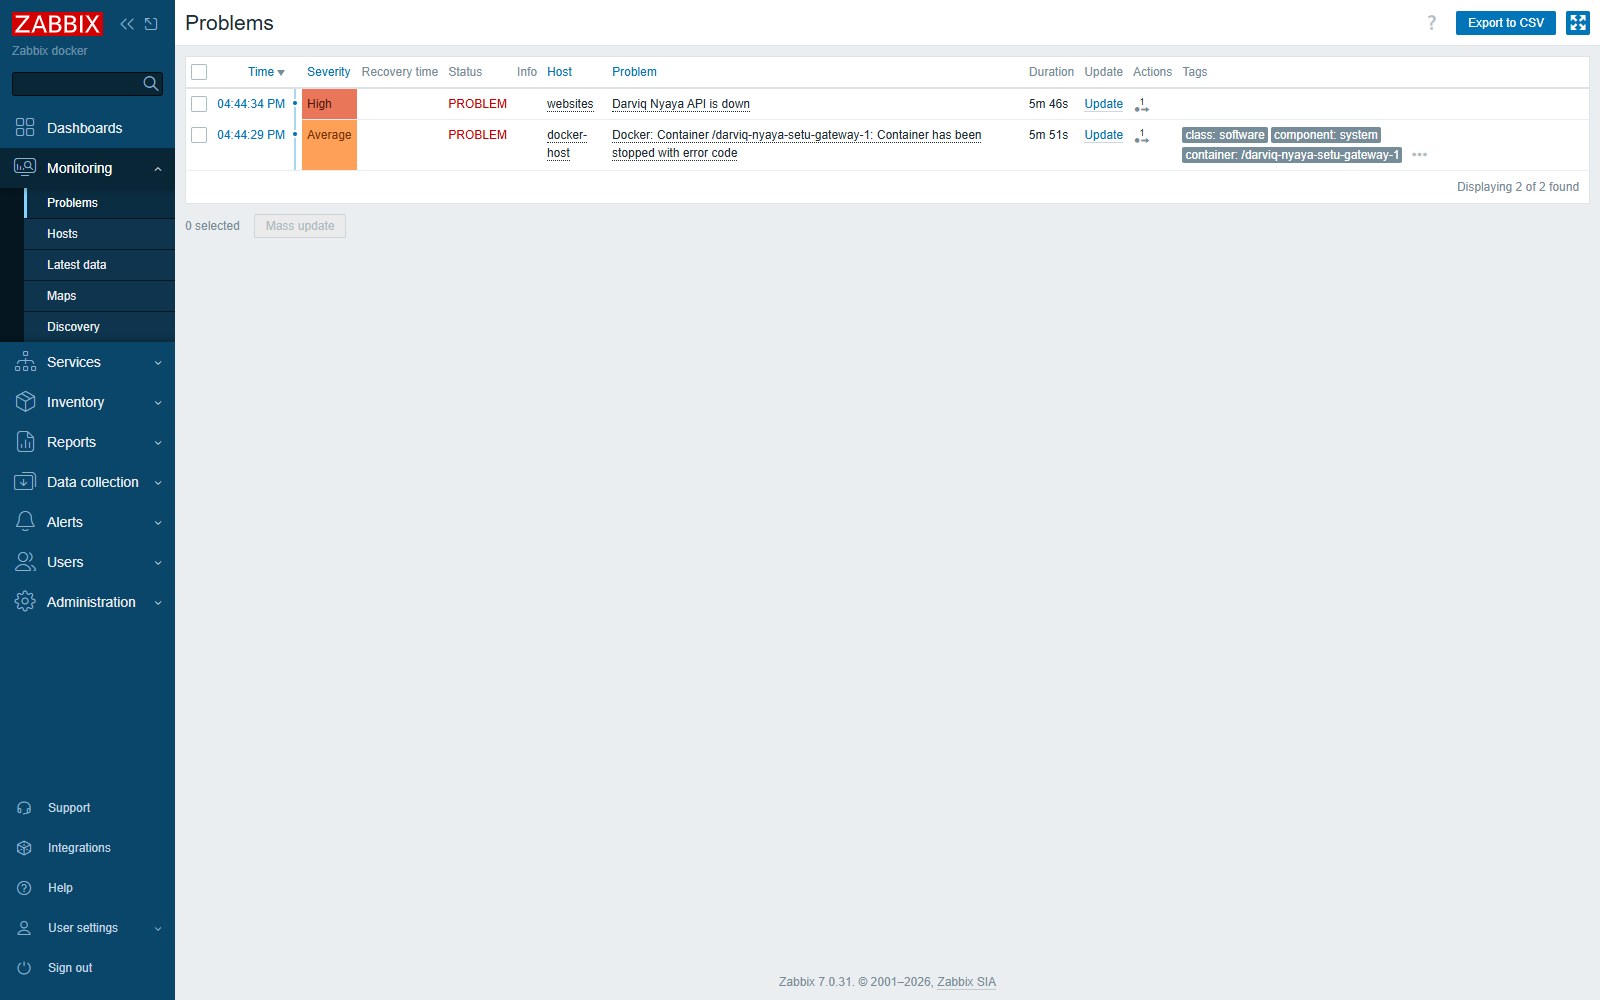
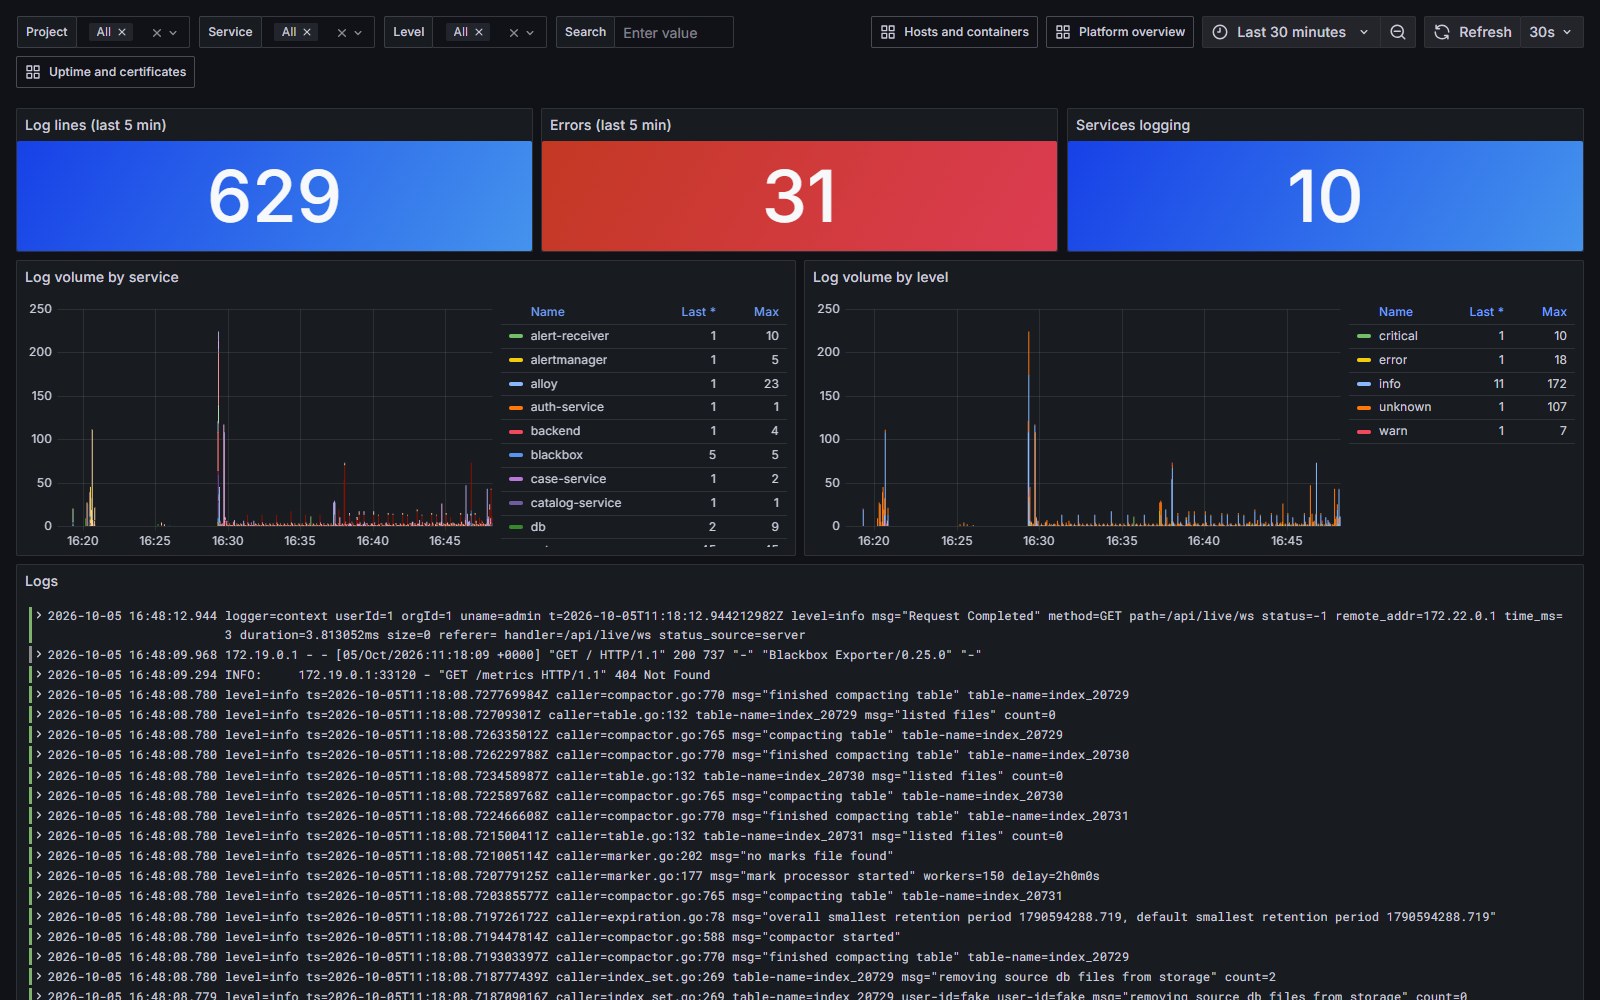
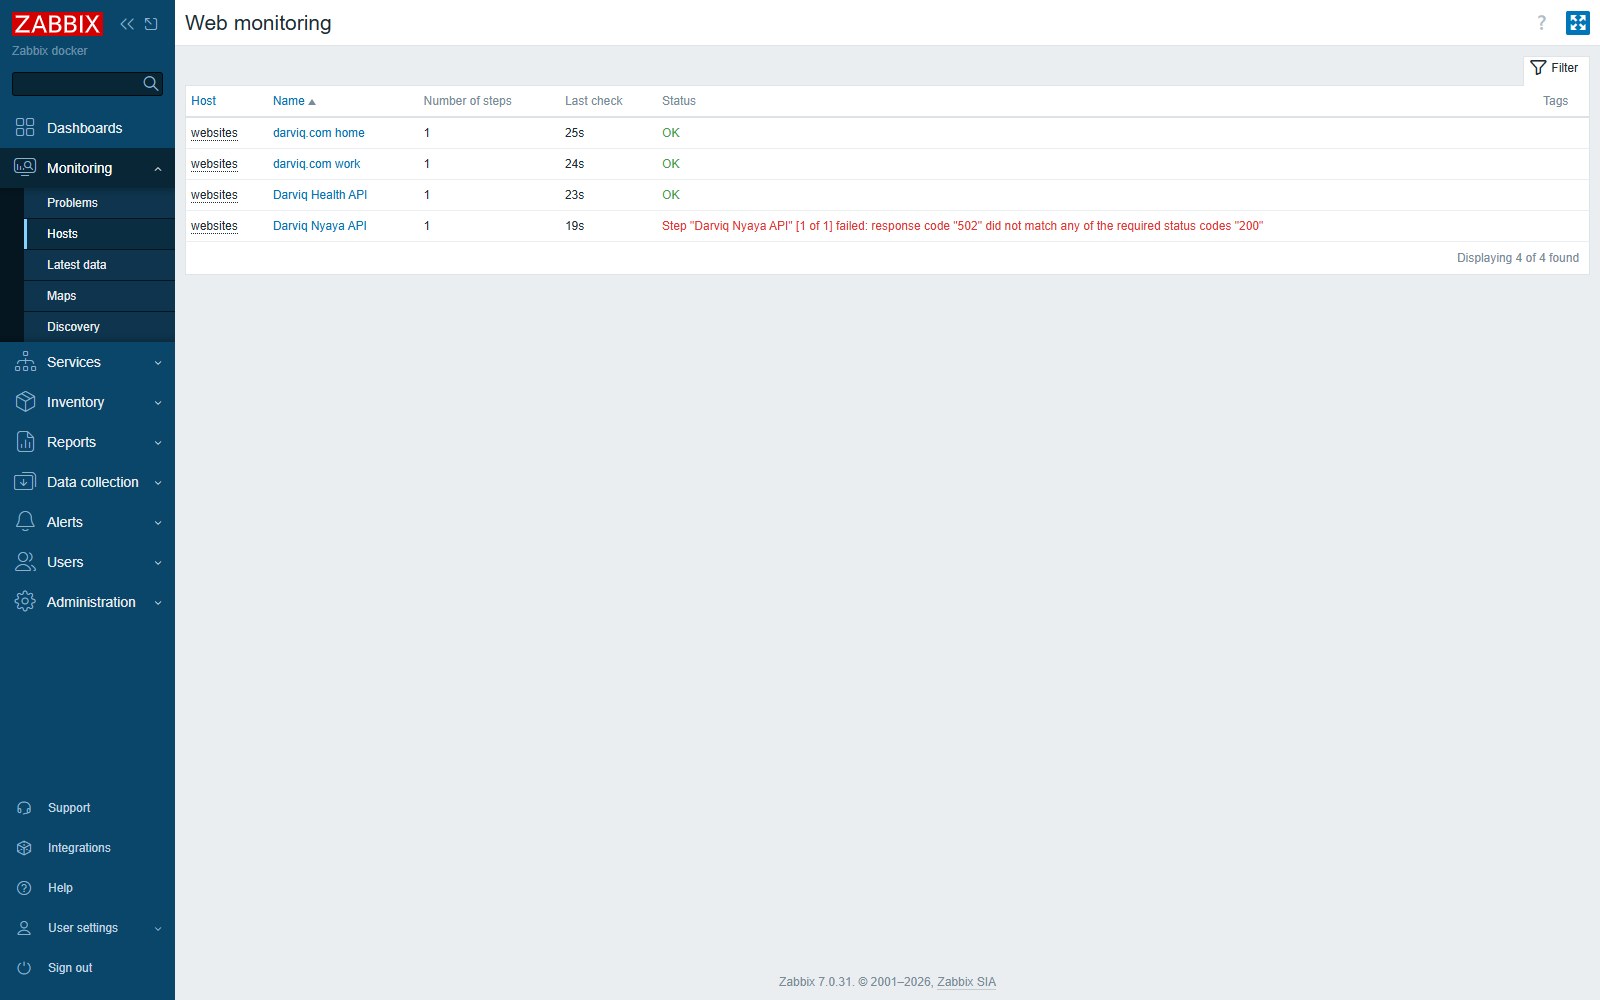
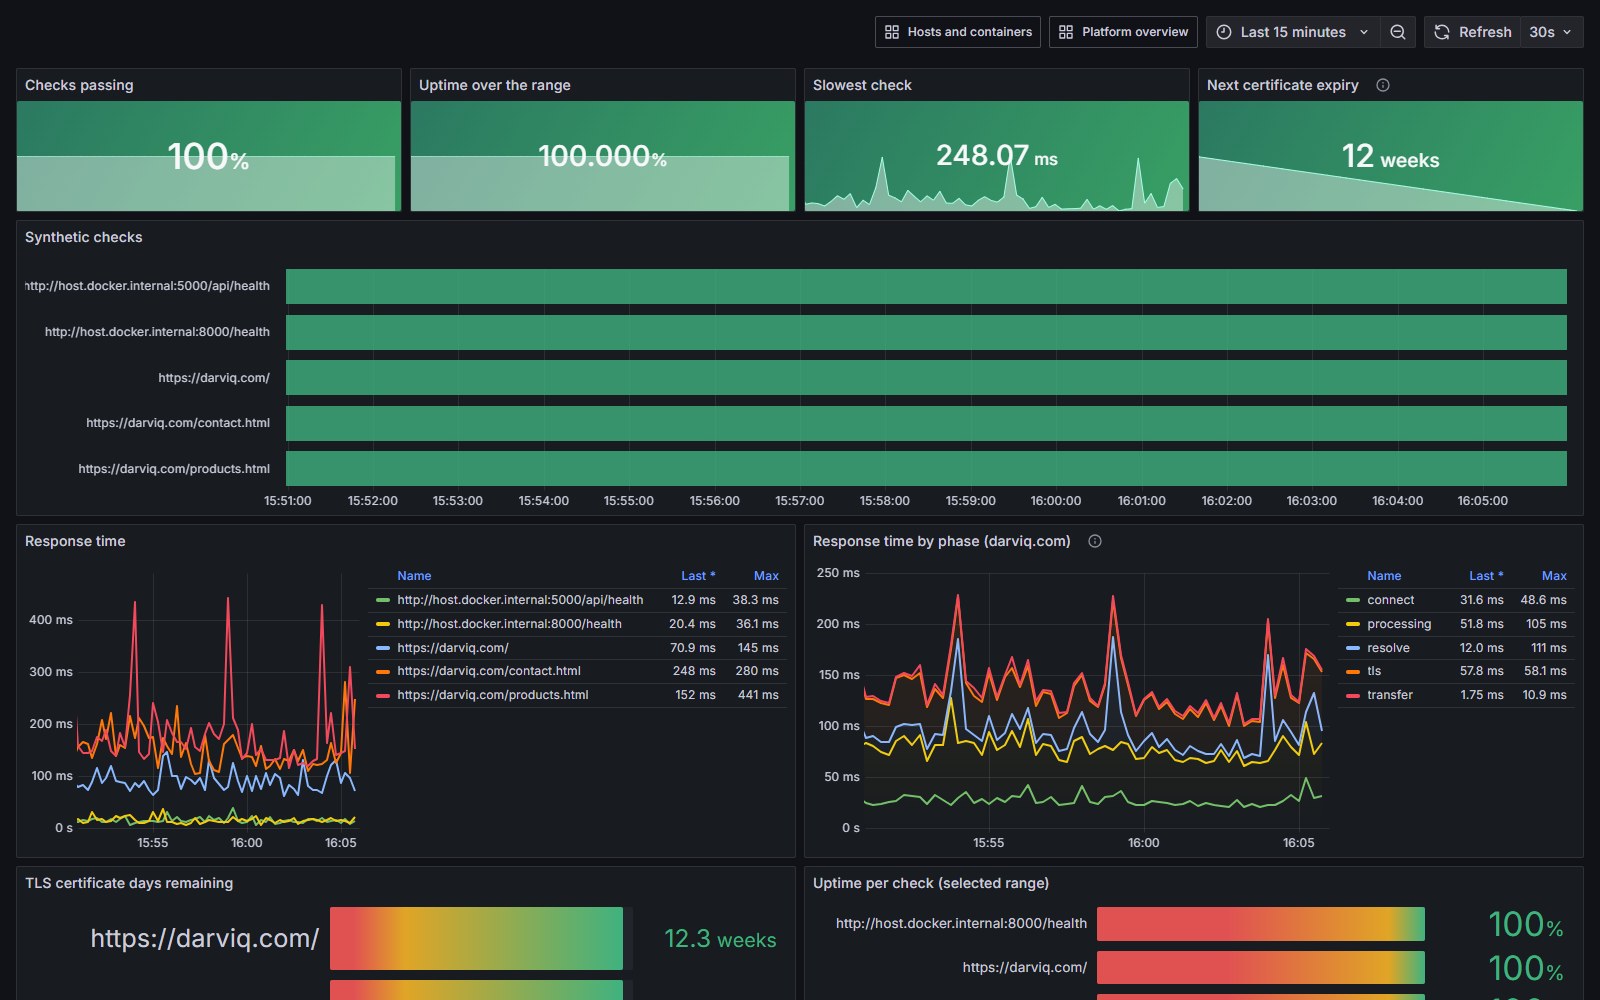
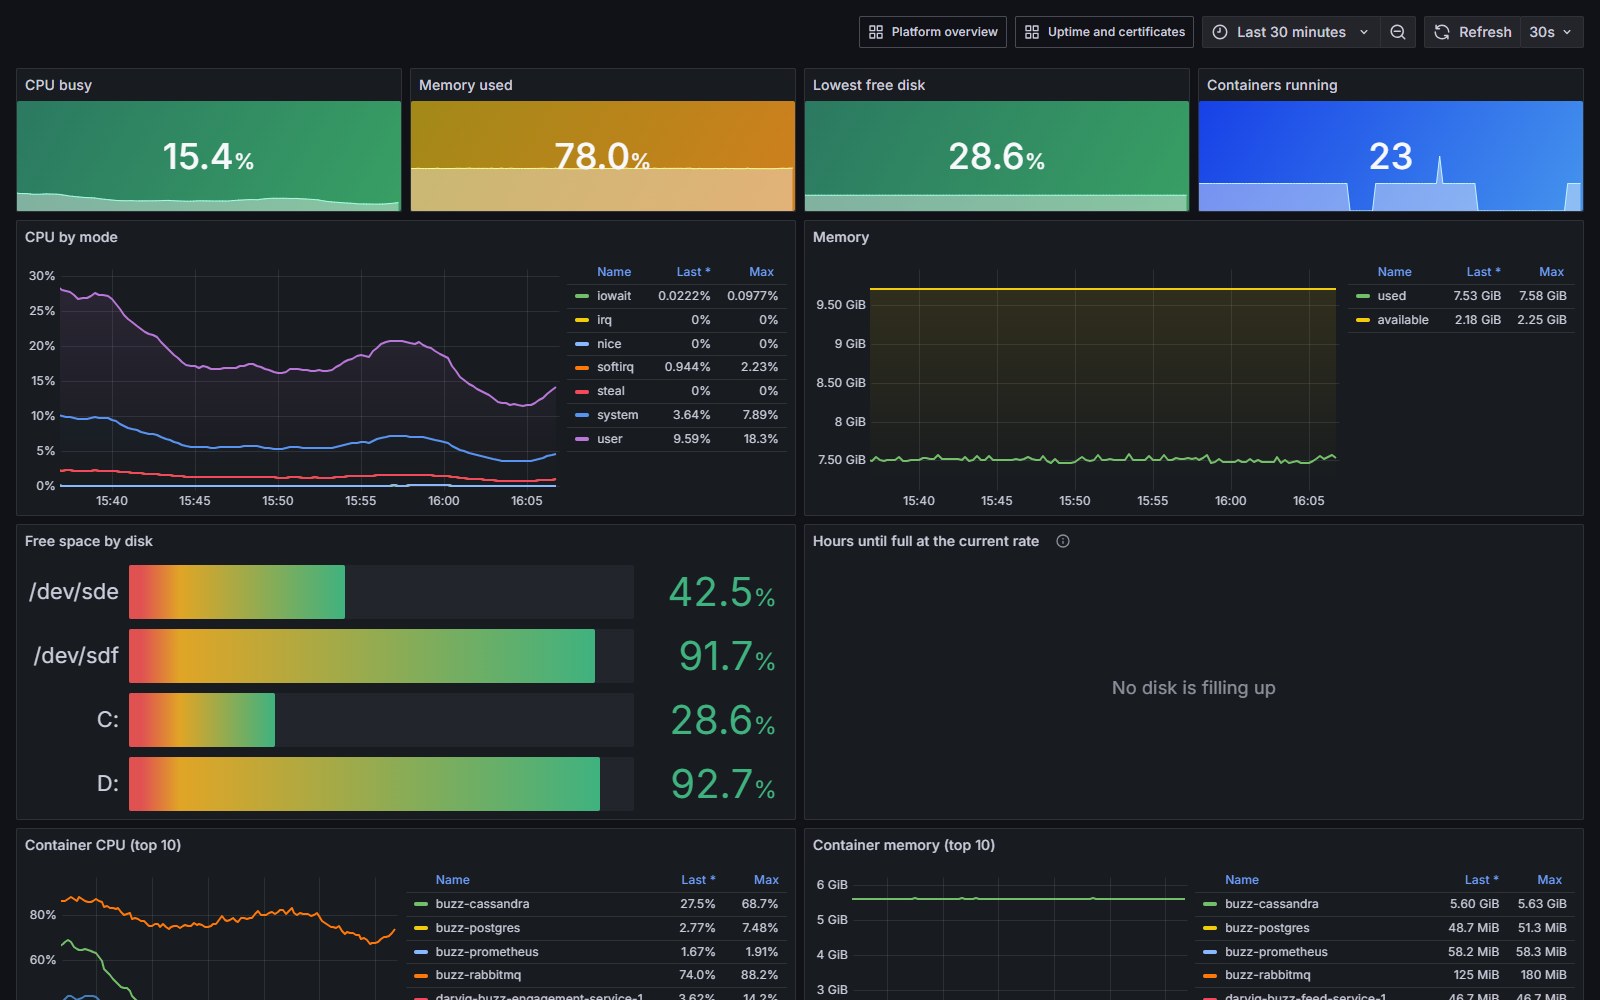
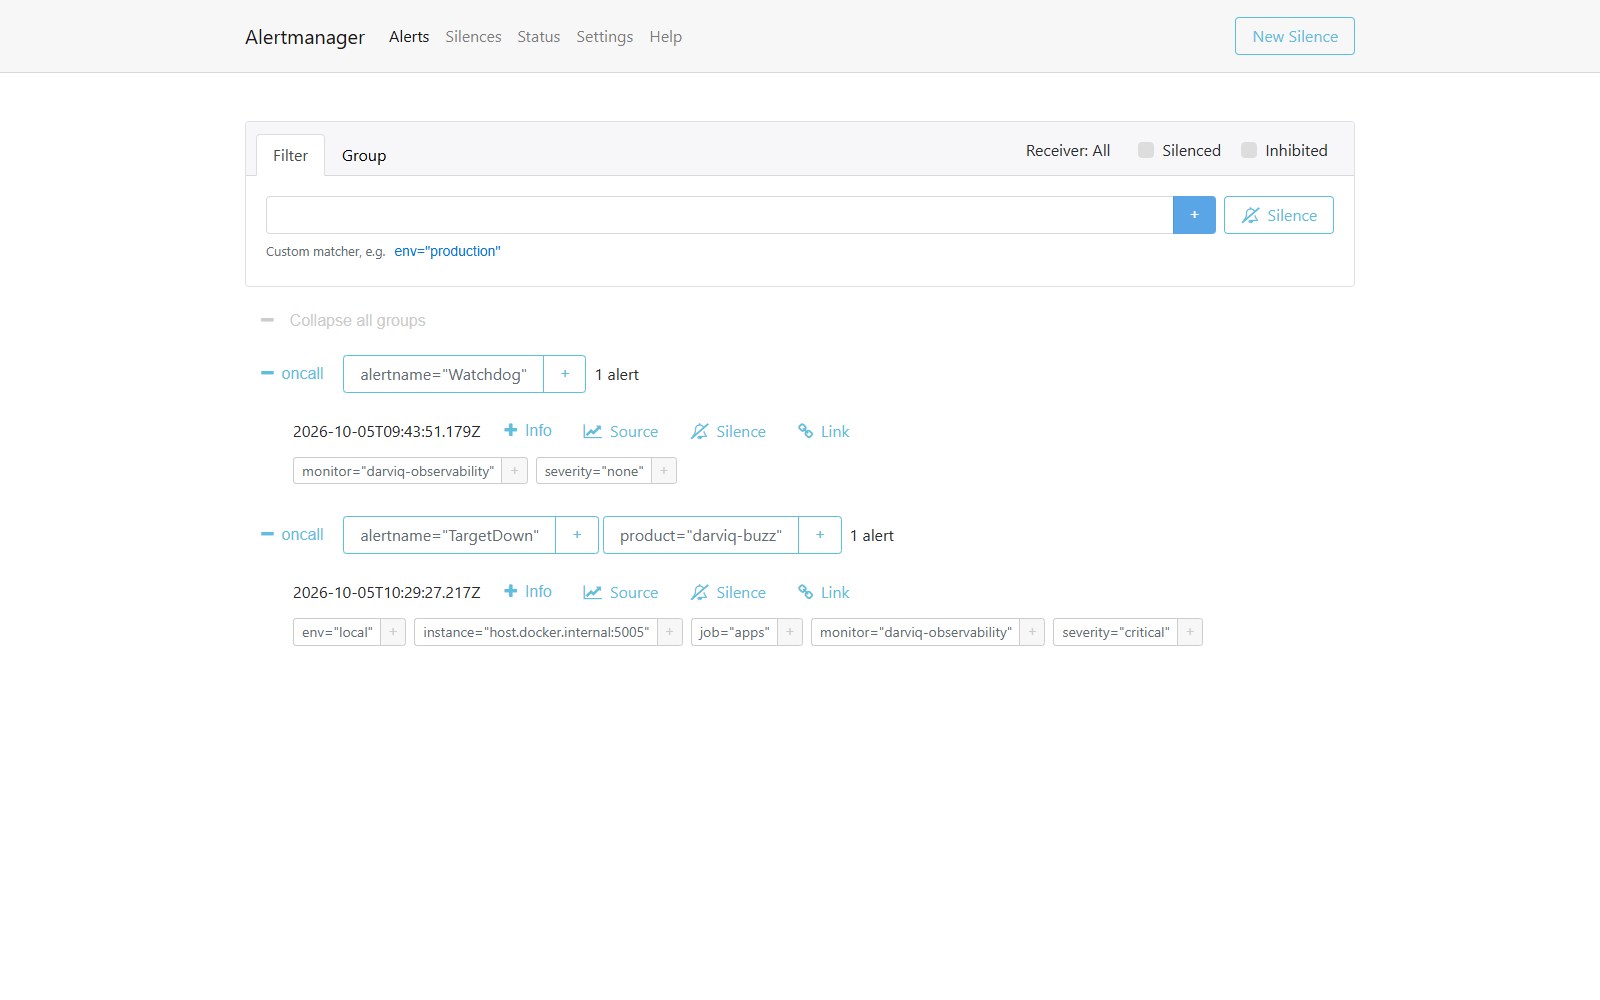
Real dashboards from the running stack. Buzz traffic came from a scripted set of simulated visitors. Click a screenshot to enlarge it.
In its first hour, a real bug in Darviq-Buzz (mistyped links returned server errors instead of "not found"), fixed the same day, and a home page running just over its 500 ms speed target. Live drills also tuned the alerts themselves, so an outage raises one clear alert instead of a pile of duplicates, and stopped alert notifications from being counted as error logs and raising more alerts.
Taking it to production: the same rules, tests, dashboards and runbooks run on a VM beside the workloads, on Kubernetes through Prometheus Operator and the Loki, Zabbix and Datadog Helm charts, or on Amazon Managed Prometheus and Managed Grafana.
Orbital mechanics, and what's next for robotics and AI. Visit the Lab →
Book a short call and we'll walk you through the clinic workflow on live sample data.